Growth, Standards and Accountability
NCME Annual Meeting, April 15, 2009
Center for Assessment
Growth, Standards and Accountability
Growth, Standards, and Accountability:
Dominant (and linked) themes in education today.
- Growth
-
Examination of student achievement over time.
- Standards
-
Broadly used to anchor judgments and qualifications of education quality.
- Accountability
-
Currently focus on assignment of responsibility for performance (e.g., school accountability).
Growth, Standards and Accountability
Is it possible to better connect these three themes?
Angoff (1974): “Scratch a criterion and you find a norm”
Need BOTH norms and criteria to make sense of the world.
Normative growth is a lens that can illuminate a number of important relationships.
Growth and Standards
What rates of student growth are necessary for students to reach desirable performance standards?
Are these rates of growth realistic for all students?
Standards and Accountability
Given current performance standards, are universal performance (i.e., proficiency) mandates realistic?
What do we mean by “easy” and “hard” standards?
Can a balance between ambitious yet reasonable performance targets be struck?
Growth and Accountability
What levels of institutional effectiveness are required to fulfill universal proficiency mandates?
Are these levels of effectiveness reasonable?
Is failure to reach these levels of effectiveness the sole responsibility of the education system?
Describing Student Growth
Measuring student growth, even with a vertical scale, is not a simple task.
Even with an interval (or ratio) scale, growth is not easy to interpret. Consider, for example, height.
A child might grow 4 inches between ages 3 and 4.
4 inches is a well understood quantity.
The 4 inch increase becomes really meaningful only when understood alongside the growth of other 3 to 4 year olds.
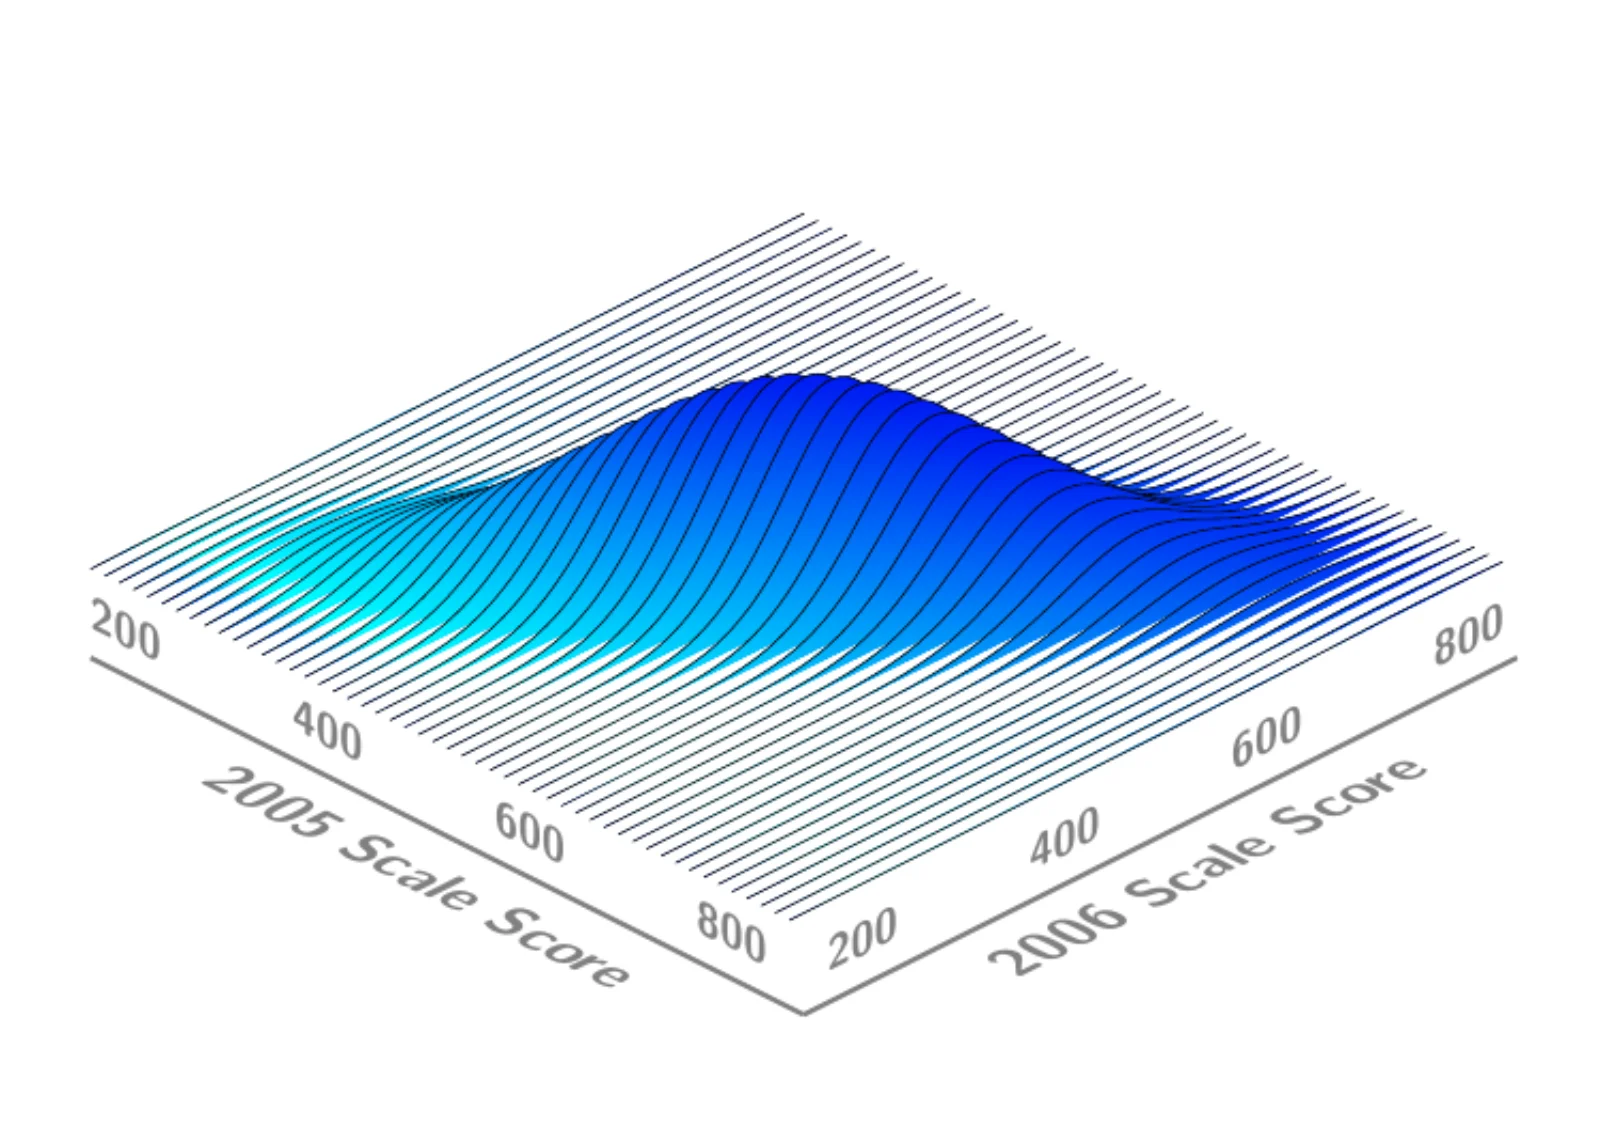
Student growth percentiles were developed to provide a normative context for describing student growth.
Joint Distribution of 2005 and 2006 Scale Scores
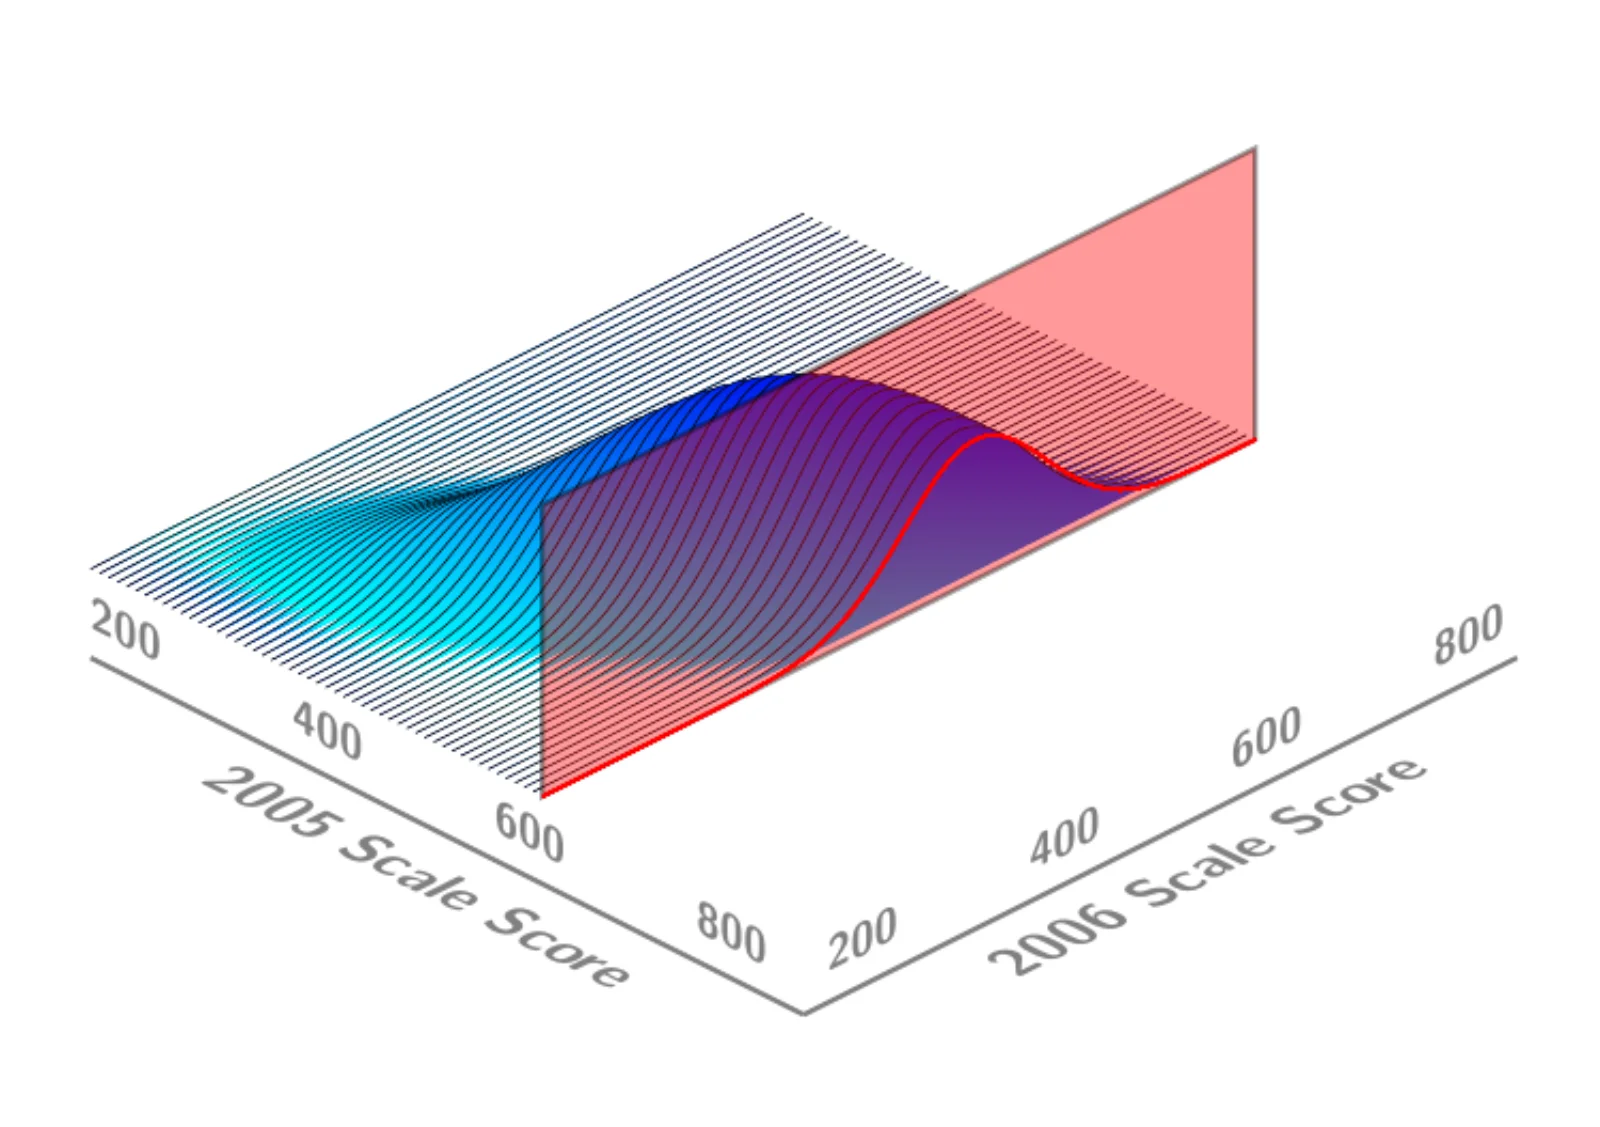
Conditioning on a 2005 Scale Score
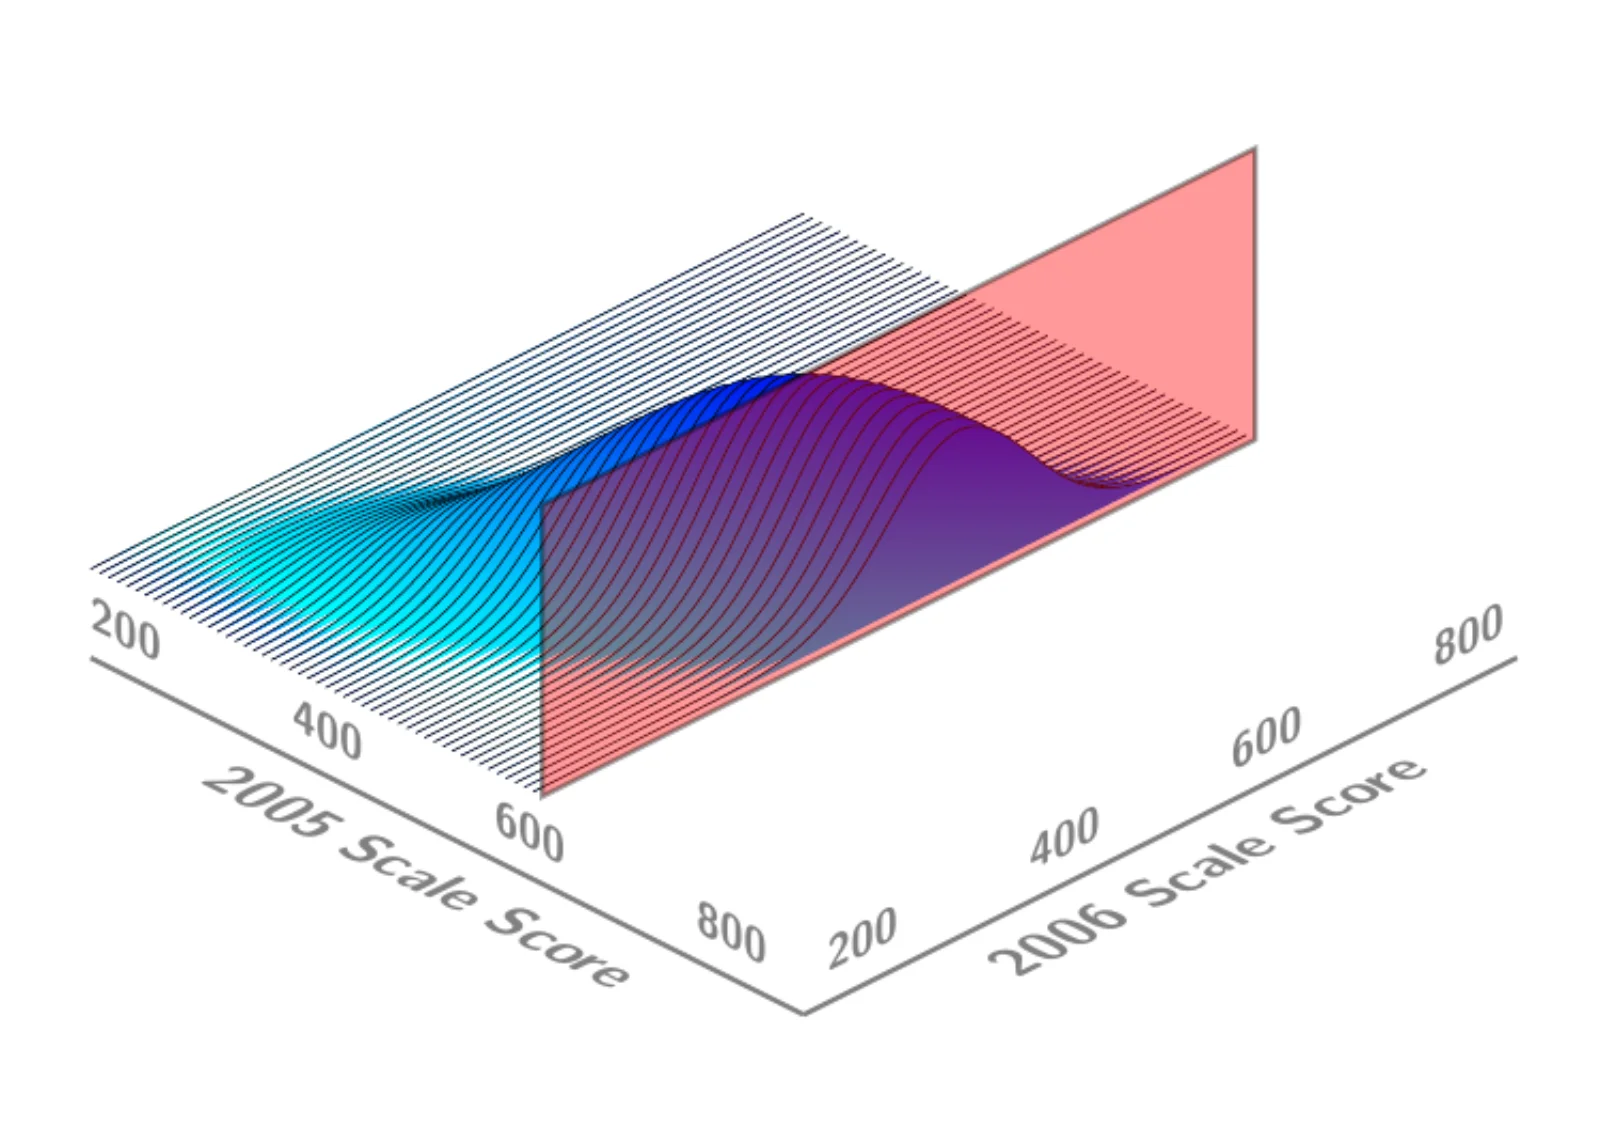
Conditional Distribution of 2006 Scale Scores
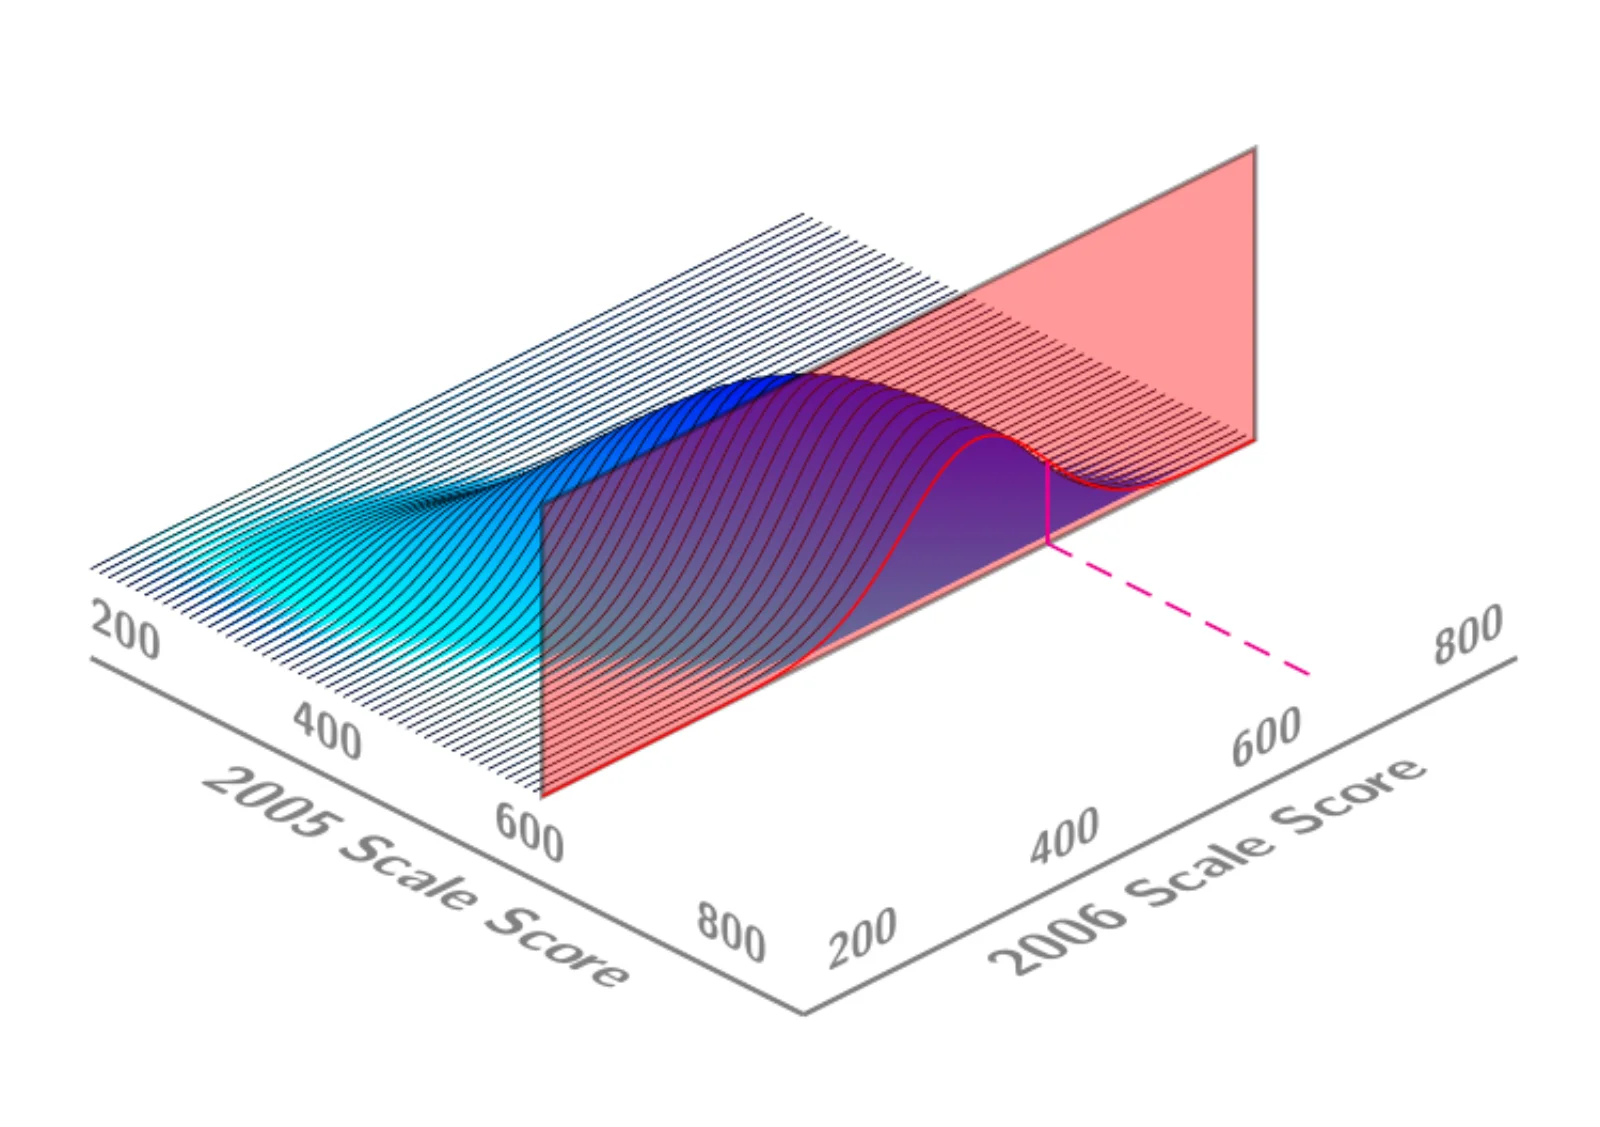
Locating a Student’s 2006 Score
Normative Growth Model
Should we be surprised with a child’s current achievement given their prior achievement?
Quantile regression is used to model the conditional quantile functions.
B-spline smoothing is applied to accommodate non-linearity, heteroscedasticity, etc. Scatterplot Smoothing
The method is a quantile regression based generalized additive model (Hastie and Tibshirani 1990; Wood 2006)
Implemented in R using SGP Package
Normative and Criterion-Referenced Growth
“Adequate” Growth: Is a student’s (normative) growth sufficient to reach/maintain desired performance standards (e.g., proficiency)?
Norms are blind to standards? Equally rare does not imply equally good.
Using the coefficient matrices from the quantile regression analyses, percentile growth projections/trajectories are calculated for each student.
These “growth-to-standard” trajectories indicate what it will take for the student to reach/maintain proficiency and other performance standards.
The Colorado Growth Model was recently approved as part of the Growth Model Pilot Program using this approach.
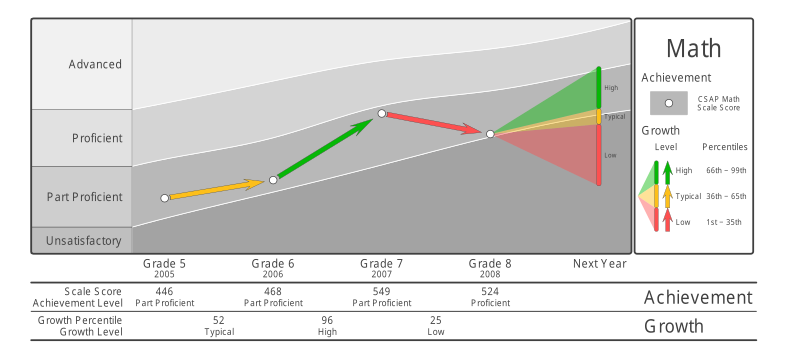
Individual Growth and Achievement Report: Math
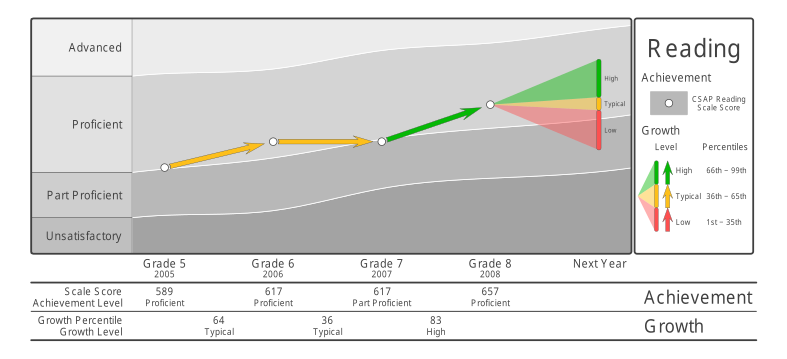
Individual Growth and Achievement Report: Reading
An even bigger picture
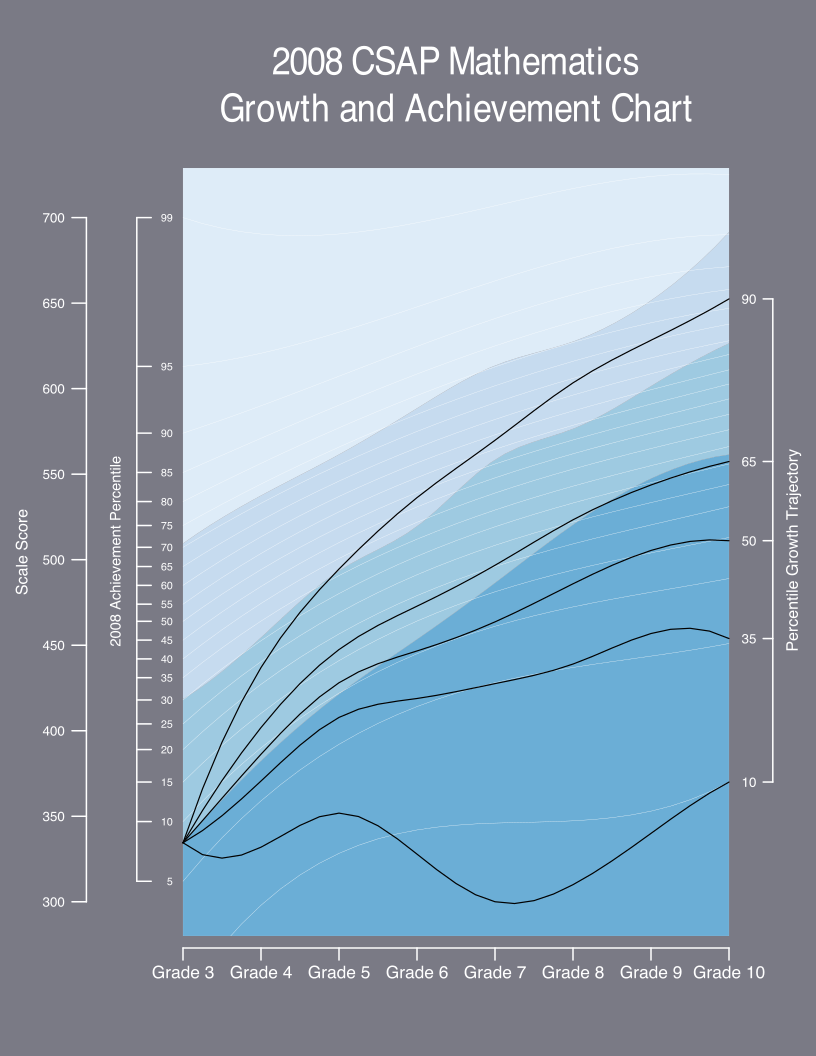
The education system, being composed of students, can be examined similarly.
Using performance on annual student assessments, consider an entire education system over time.
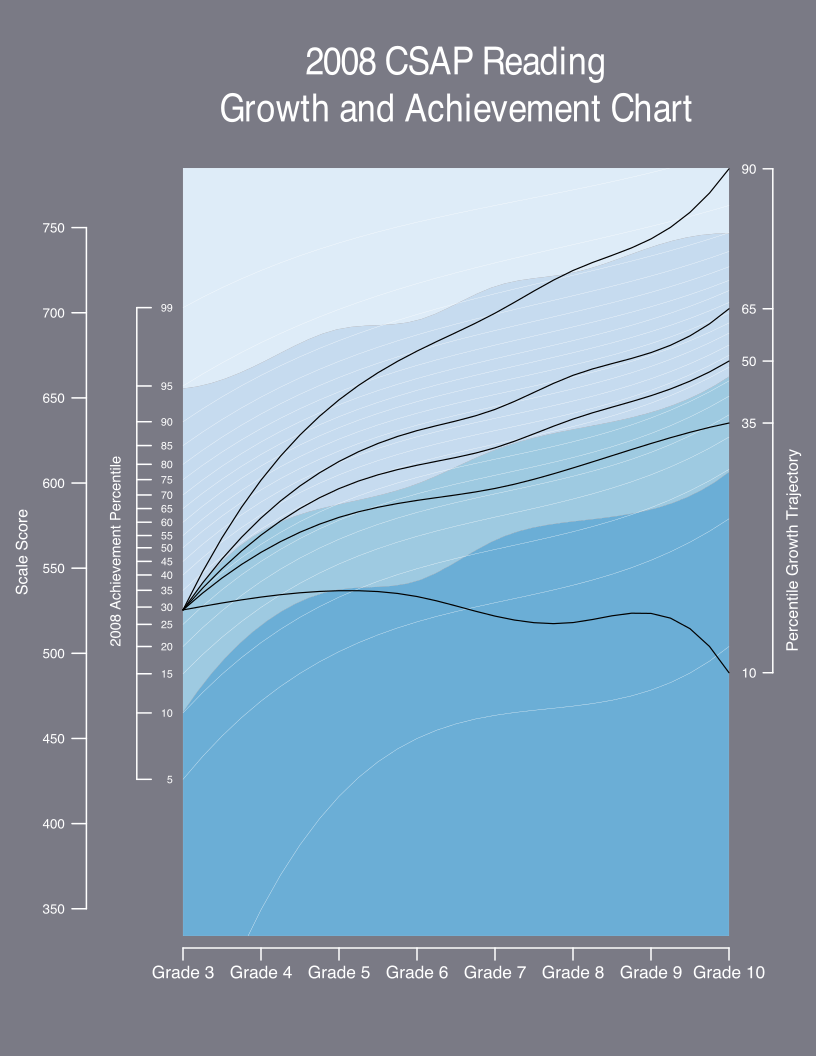
Standards and norm referenced interpretations are necessary to grasp the performance of the system in it’s entirety.
Looked at appropriately, there is a beautiful (and predictable) interplay between norms and standards.
2008 CSAP Mathematics Growth and Achievement Chart
2008 CSAP Reading Growth and Achievement Chart
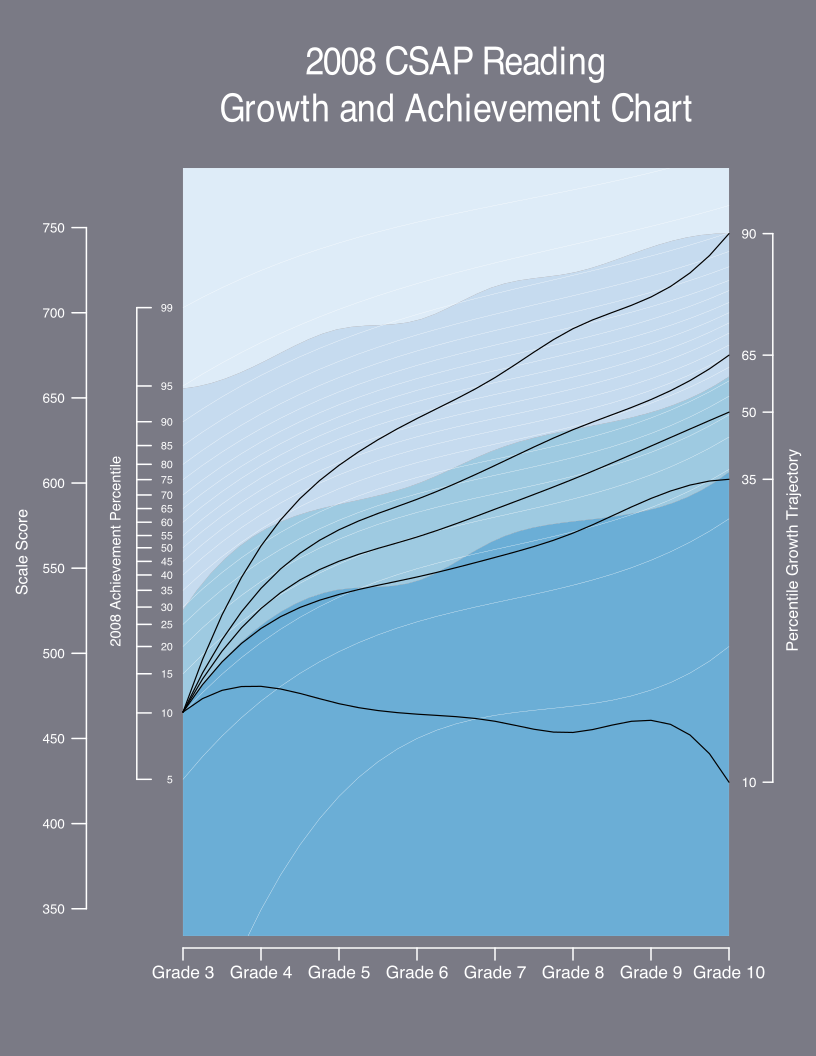
2008 CSAP Reading Growth and Achievement Chart
Growth and Standards
What rates of student growth are necessary for students to reach desirable performance standards?
Are these rates of growth realistic for all students?
Standards and Accountability
Given current performance standards, are universal performance (i.e., proficiency) mandates realistic?
What do we mean by “easy” and “hard” standards?
Can a balance between ambitious yet reasonable performance targets be struck?
Growth and Accountability
What levels of institutional effectiveness are required to fulfill universal proficiency mandates?
Are these levels of effectiveness reasonable?
Is failure to reach these levels of effectiveness the sole responsibility of the education system?
Conclusions
Norm shouldn’t be a four letter word.
Performance standards across grades that are (normatively) (dis)similar will lead to (un)reasonable growth trajectories.
A “growth model” anchored to standards will not save you from uneven standards.
Normative effectiveness models (value-added models) are blind to standards (so they save you in that respect)
Conclusions
If resetting standards or transitioning to a new assessment, having growth data prior to standard setting will probably be helpful.
Normative growth data would give a sense of what current student progress currently looks like.
The goal is to balance what is, what should be, and what is reasonable.
Once that’s in place, productive discussions about responsibility/accountability can ensue.