Subverting Campbell’s Law
MARCES Conference, October 18, 2012
Center for Assessment
Campbell’s Law
The more any quantitative social indicator is used for social decision-making, the more subject it will be to corruption pressures and the more apt it will be to distort and corrupt the social processes it is intended to monitor (Campbell 1976).
Standardized Testing & Corruption
Not a new phenomenon in large scale educational assessment.
Corruption includes teacher/administrator cheating, student cheating, narrowing of curriculum, teaching to the test, lower student/teacher/stakeholder morale ….
Not limited to just teacher evaluation but also to institutional evaluation.
Tail (evaluation system) wagging the dog (education system).
Recent newsworthy incidents in Atlanta are likely just the tip of the iceberg.
Standardized Testing & Corruption
Through RttT and ESEA waivers, teacher evaluation has been extended to “non-tested subjects”.
As evaluation systems are mandated, the hunger for data/evidence to feed those systems becomes rabid.
Plans to utilize district, school and teacher constructed assessments in value-added analyses is not uncommon.
The potential for corruption is huge (e.g., artificially depress pre-scores).
Cheating with growth/value-added requires less “effort” than cheating with status: One only needs to get a couple more questions right.
Living with Campbell’s Law
I’m an optimist: I hold out hope that the human species can learn from evidence and make itself better.
I’m also a skeptic: I have a feeling that the next 10 years will prove my optimism to be foolish.
The likely reason for failure will be Campbell’s Law.
Is it possible to overcome, circumvent, or just even minimize the effects of Campbell’s Law.
That, I’d argue, is the main task confronting all of us.
Living with Campbell’s Law
Coherent
Coherence with larger policy goals.
Coherence within/across multiple levels of the system.
Coherence with “reality”.
Comprehensible
- Comprehensible to both the general public and professionals.
Comprehensive
Use indicators to thoroughly vet other possible explanation.
Use multiple indicators (i.e., pieces of evidence) to triangulate upon root causes.
Norms & Criteria
Policy goals have morphed from universal proficiency to universal career and college readiness.
Policy goals have also changed to include comprehensive school and teacher evaluation as manifest in RttT, ESEA waivers, TIF, …
State education accountability policy today extends from individual, to classroom, to school, to district, to state.
These policy goals, particularly when enacted with incoherent indicator systems, often lead to policy failure.
Norms & Criteria
Fundamental challenge: Being fair to students while simultaneously being fair to adults (building fair evaluation systems).
Avoid setting different expectations for students (see recent incidents with ESEA waivers in Virginia and Florida) with fair evaluation systems.
Different unconditional (i.e., status) expectations versus different conditional (i.e., growth) expectations.
Differential Impact ≠ Bias: See, for example current large scale assessment systems.
Differential impact does not necessarily imply an unfair system. What passes the smell test?
Norms & Criteria
From a tyranny of norms in the 80s and 90s to a tyranny of criteria in the early 21st century.
NCLB and ESEA waivers for institutional accountability are criterion referenced: directed toward universal proficiency.
Teacher evaluation using large scale assessments is almost exclusively norm-referenced.
Making the system coherent requires a blending norm- and criterion-referenced interpretations.
The proliferation of distinct and incoherent evaluation systems (institutional, personnel) threatens to detach evaluation from larger policy goals.
Norm- and Criterion-Referenced Accountability
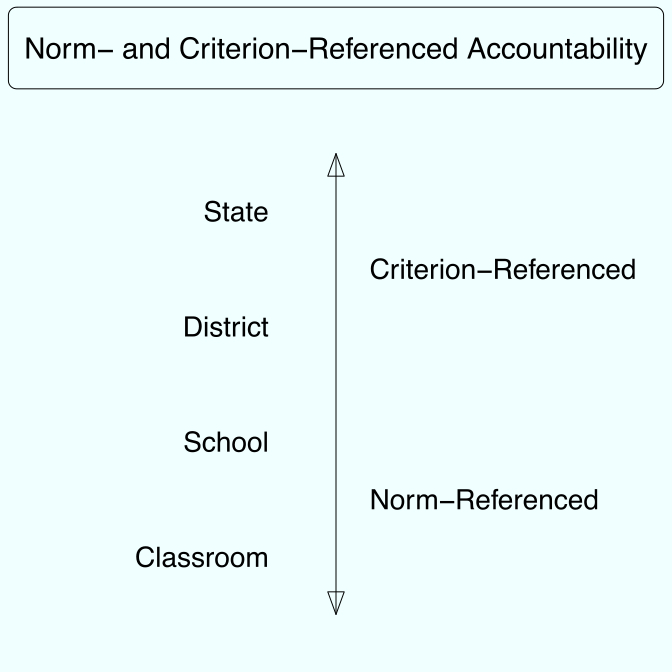
From norm to criterion referenced
At the state level, a state referenced norm provides no information.
How does one answer the question of whether a state education system, as a whole, is “adding value”?
This requires the system to be anchored to some baseline set of criteria (e.g., performance standards).
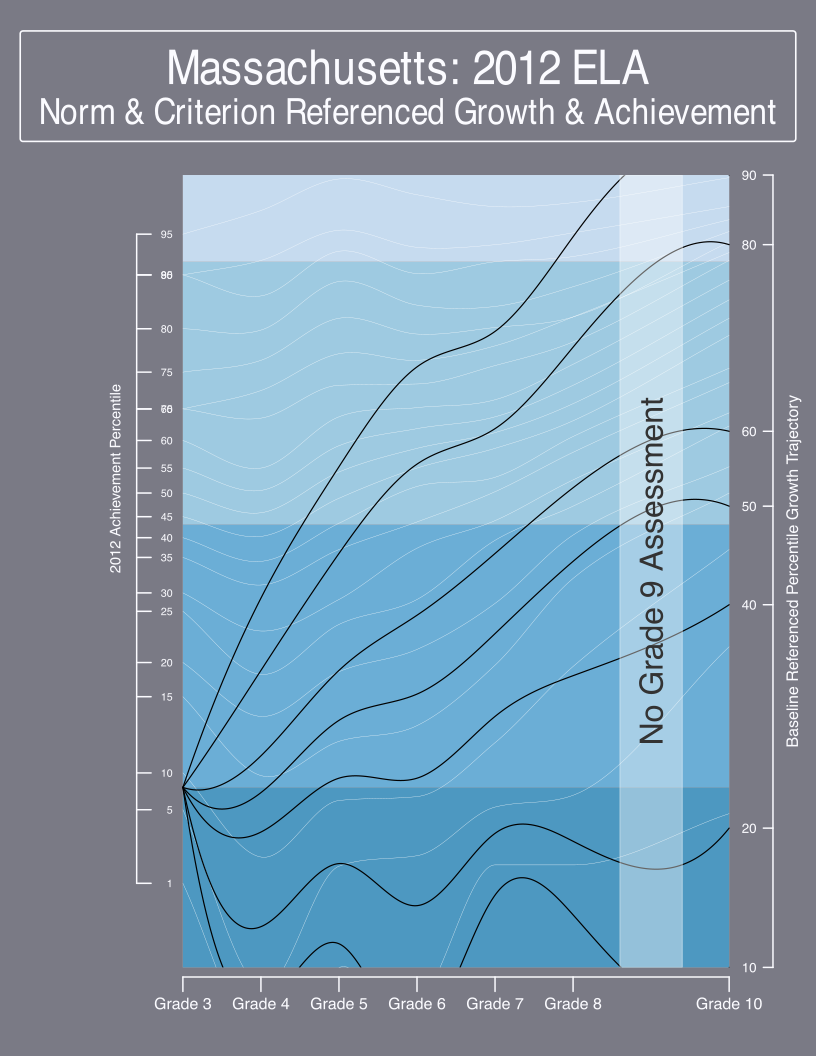
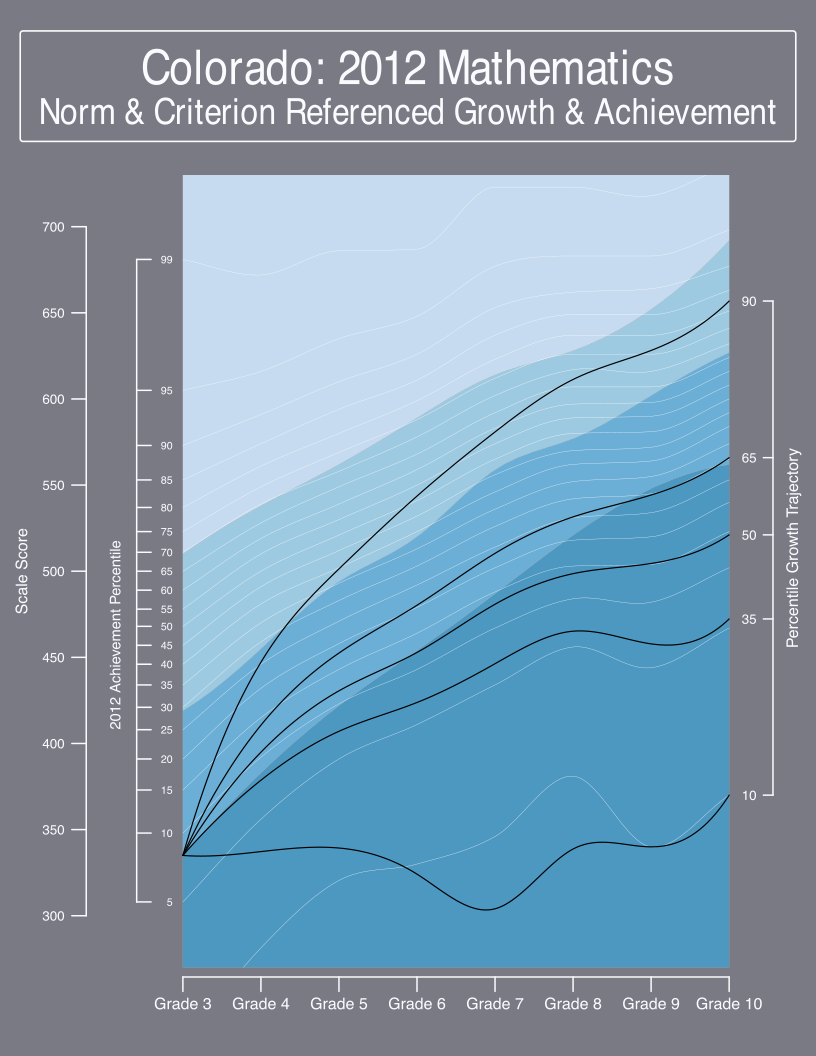
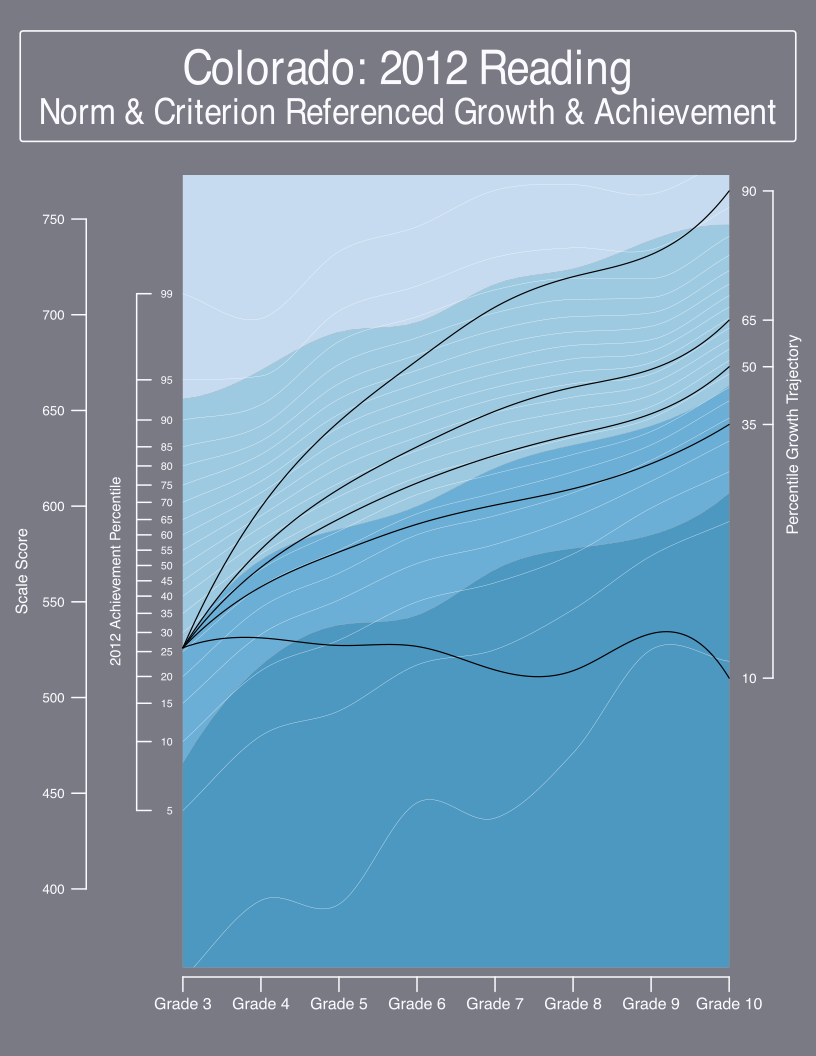
Growth to standard or baseline referenced growth/VAM analyses provide one possibility for addressing state level characterizations of value-added/growth.
Massachusetts: 2012 ELA
Colorado: 2012 Mathematics
Colorado: 2012 Reading
West Virginia: 2011–2012 Mathematics
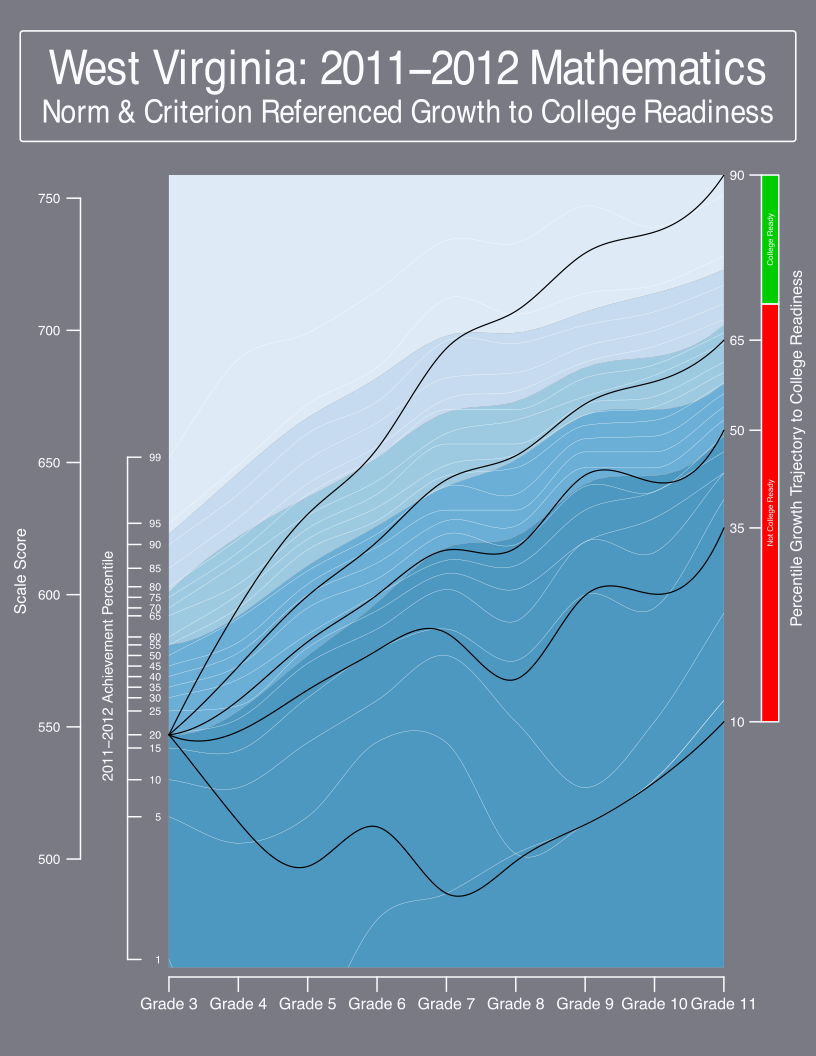
From norm to criterion referenced
As one moves from state to district to school to classroom, criterion referencing becomes less relevant.
Teacher evaluation using VAM/growth are almost exclusively norm-referenced.
Confusion between norm- and criterion-referenced indicators is often misunderstood.
Moving beyond the tyranny of norm- and criterion-referencing requires utilizing both.
Blending Norms and Criteria
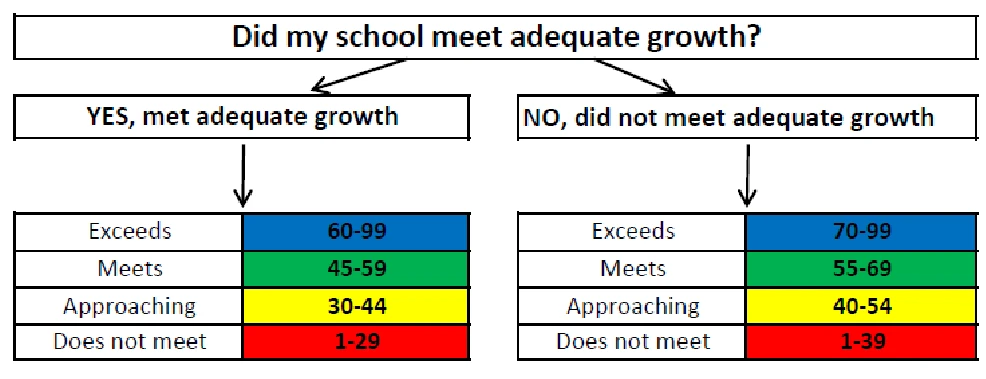
Blending Norms and Criteria
Colorado’s School and District performance frameworks blend norm and criterion referencing.
What is typical, or even slightly above typical for schools serving lower achieving students is not enough to get students to desirable achievement levels.
The tries to balance norm- and criterion-referenced standards for school and district evaluation setting more ambitious, but reasonable goals for schools serving low achieving students.
Norm-referenced Classroom analyses
Analyses at the classroom/teacher level are almost exclusively norm-referenced.
Debate about whether norms should include additional variables besides prior student achievement are frequent.
Additional variables can include both individual (e.g., demographic) and group level characteristics (e.g., mean prior group achievement).
Differential impact often mandates adjustment but states are approaching these topics very carefully.
Internal Coherence
Face validity: Do the results pass the “smell test”.
What is the relationship between poverty & classroom/school effectiveness indicated by the model?
What is the relationship between prior achievement & classroom/school effectiveness indicated by the model?
Recent papers (e.g., Ehlert et al.) are directed toward discussion of the most useful comparison.
As data becomes more and more available, edge cases will become front page headlines.
Recent stories from New York are likely (meet the worst teacher in New York City)
States with test ceilings often demonstrate model misfit at the extremes, especially for a large class of linear models.
Phenomenon is especially pronounced with a significant proportion of students score at the ceiling.
Public Comprehension
User Experience: Stakeholder engagement is critical and requires a broad communication strategy.
Being able to comprehend is not the same as being able to calculate.
Lack of comprehension amongst stakeholders is a result of lack of relevant/understandable vocabulary and use cases for that vocabulary.
Communication of assessment results don’t digress into IRT methodology. Why must explanations of growth/value-added often digress into explanations of regression?
It is critical to be able to communicate results without resorting to the “R” word.
Individual Growth and Achievement Report: Reading
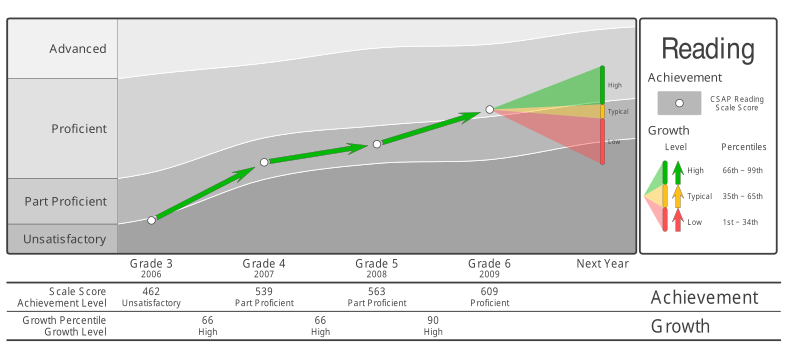
Communication of results
A grossly ignored area of research
We are currently in the initial stages of a renaissance in data visualization
It is no longer necessary to fit results (and the stories they support) onto an 8 1/2 by 11 sheet of paper.
Interactive technology via intuitive navigation support complex data narratives that can’t fit onto a single sheet of paper.
Enhanced user experience with education data is largely untapped.
Professional Comprehension
Analytic techniques utilized for teacher/institutional evaluation are often closed and proprietary.
Publication of statistical methodology falls far short of showing how that methodology is enacted in software.
Will contested evaluations based upon closed methodologies withstand legal scrutiny?
The field would benefit greatly from greater transparency including open sourcing of analytic techniques and non-confidential data derived from these techniques.
Open Source ≠ Public Domain: There are a variety of open source licenses that allow creators to maintain control over the various ways in which their work is used.

Comprehensive exploration of root causes
The heightened focus on teacher evaluation has left teacher feeling “picked on”.
Improvement in teacher evaluation systems should not come at the exclusion of comprehensive investigations of root causes that extend beyond the teacher.
There are numerous complicating factors that cloud the attribution of responsibility to the teacher.
Institutional transitions impact the growth rates of students.
These transitions do not occur uniformly with state or even within district (e.g., middle schools and junior high schools).
The impact can be so large that it makes “signal detection” at the teacher level impossible.
Comprehensive Evaluation Systems
The use of large scale assessments for educator/institutional evaluation is low hanging fruit.
Collecting and combining multiple sources of evidence is the status quo in all state evaluation systems.
Moving beyond Campbell’s Law requires embracing more data and reconciling often conflicting pieces of evidence.