Assessment Reporting in Support of Student Learning
NCME Annual Meeting, April 12, 2024
Damian W. Betebenner
Center for Assessment
Adam VanIwaarden
Center for Assessment
My Background in Assessment Reporting
- Began work at the Center for Assessment in 2007 wanting to “take over” the growth model world developing Student Growth Percentiles (SGP)
- Wanted to make analytics cheap/open and focus on reporting to make the data useful.
- Co-developed the SchoolView interactive data visualization platform with the Colorado Department of Education and deployed it to 5 states (no longer in use).
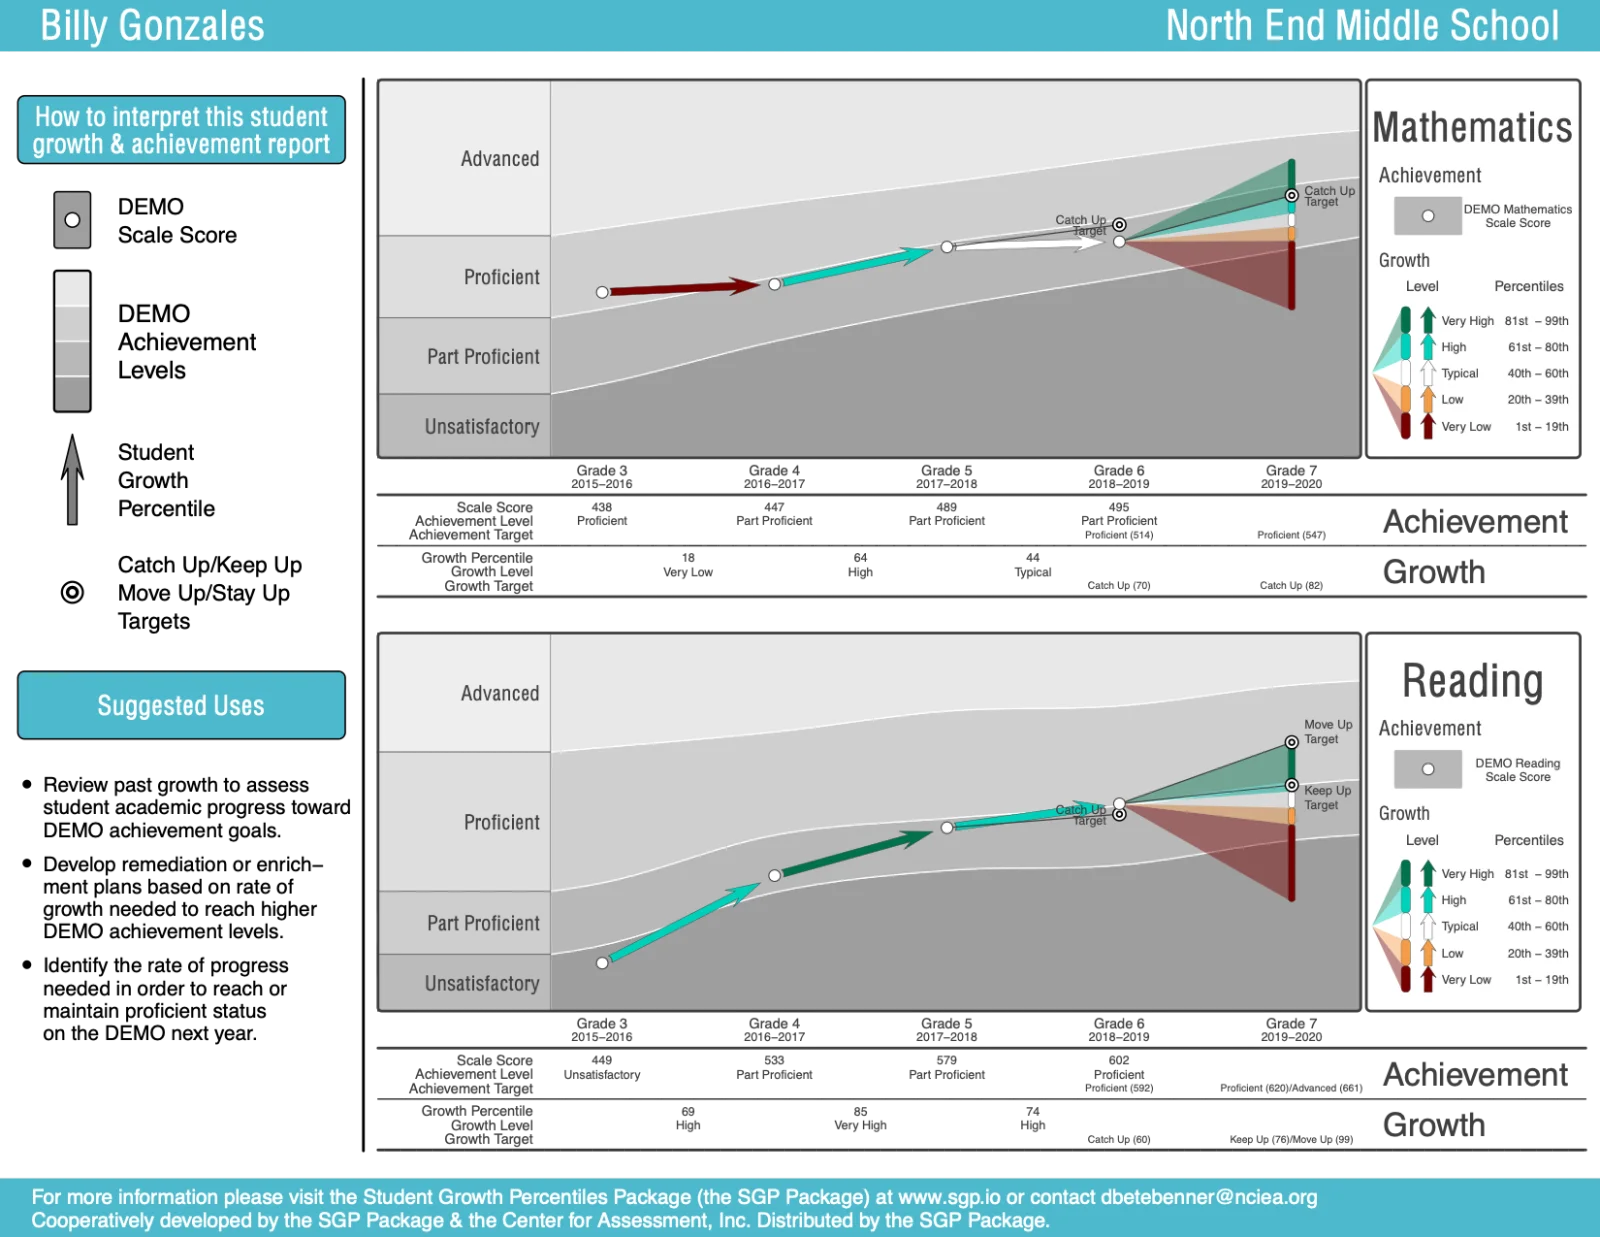
- Developed PDF based individual student reports as part of the SGP package. Currently used by several states to produce approximately 1 million student reports/year.
- My strong belief from the beginning is that bigger improvements in education are possible through reporting and use of data versus the derivation of “better” data.
Individual Student Growth and Achievement Report
Lessons Learned
- I’ve learned several lessons along the way.
- I hope to share and dive into a few of these lessons today
- Data is/are worthless, it’s what one does with it/them that is valuable.
- Data ≠ Information: Ideally our reporting efforts transform data into information.
- Data visualization, especially when designed by data specialists like ourselves, is oftentimes self indulgent: More suited for ourselves than the users we want to inform.
- Terminology/vocabulary in our field is a mess.
- Reporting needs to move from “actionable” to “actions”.
Data are worthless
- We live in a world where data have become extremely cheap.
- Education data producers (Interims, state assessments, NAEP, SEDA) are competing for prominence.
- Secondary data analysis on assessment data just adds more data to an already overflowing pool.
- A more important endeavor (IMHO) is how to help stakeholders make better sense from the massive amounts of data we already have to improve student learning.
Data ≠ Information
- Maybe it’s just semantics, but semantics are important.
- Our profession is dedicated to the craft of producing education assessment data of the highest quality.
- This data is, in general, barely informative to non-technical stakeholders.
- Giving people data and calling it information without really understand how the data actually informs is a lie, a sales pitch, a con job.
- The SchoolView visualization platform I developed seemed informative (to me). But in retrospect it wasn’t nearly as informative to the non-technical stakeholders that I was trying to inform.
- Even the highly graphical (info-graphic) student reports that I produced to be “self-explanatory” require a large amount of background knowledge to understand.
Gratuitous Data Viz
- The majority of data-visualizations most of us have seen as part of our training are designed for data specialists.
- Creating data visualizations that inform non-specialists is EXTREMELY difficult and subtle.
- Scatterplots based upon two or more variables (SchoolView) is NOT the way.
- Terms like percentiles, even though somewhat familiar to many non-technical stakeholders, are intimidating and not informative.
We have a problem with vocabulary
- A primary goal of assessment reports is, presumably, to assist in student learning.
- However, an assessment does NOT measure learning!
- An assessment measures, ideally, what a student knows and can do at a point in time (i.e., what has been learned; attainment)
- Learning is an latent process that occurs over time.
- We infer learning via the use of multiple observations/assessments over time.
- We need to get much better at communicating how assessments (plural) can and should be used by teacher to assist with their teaching in service of student learning.
From Actionable to Actions (Wiley, 2020)
- The primary goal of assessment reports is, presumably, for them to be “actionable.”
- That is, a teacher, student, or administrator should be able to take an action after spending time interpreting the report.
- For that to be possible, three questions must be answered in the affirmative.
- Does the report communicate something useful? (design relevance)
- Can the user figure out what the useful bit(s) of information is(are) after studying the report? (data/visualization literacy)
- Can the user figure out what to do based on the useful bit(s) of information? (instructional design literacy)
From Actionable to Actions (Wiley, 2020)
- Why not circumvent all of the “load” placed on the end user to make sense of and then take action with the data?
- That is, reports and dashboards should be much more action focused than data focused.
- That requires that we ourselves more deeply understand these actions.
- NOTE: Actions might include collecting more data/evidence in order to know what to do.
The 5 Ws
- What, who, why, when and where:
- What? Describe the specific action those using the report should consider taking.
- Why? Explain why they should consider taking it.
- When? How soon should they decide whether or not to take action?
- Who? Who (e.g., which students) should those using the report consider taking action with?
- Where? In what format, with what tools, or in what place should those using the report take the action?
Summary
- We need to fundamentally rethink reporting of assessment results.
- And to be honest, we are probably not the right people to do the rethinking.
- Looking outside the field of education for exemplars is probably a good start.
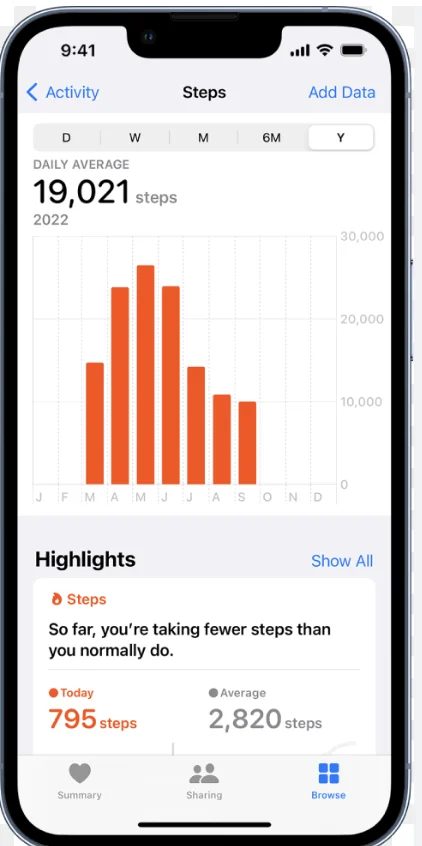
- An intriguing example I like are the fitness/health apps on the phones that we carry
Outcome vs. Process/Action
Outcome

VS
Process/Action
Thank You