Student Growth Percentiles: An Overview
Rhode Island Department of Education, May 20, 2025
Center for Assessment
Center for Assessment
About Me
Dr. Damian Betebenner, PhD
Senior Associate at the Center for Assessment (NCIEA).
Developed student growth percentiles and percentile growth trajectories to help states and educational associations employ student growth in decision making (Damian W. Betebenner 2008, 2012; Damian W. Betebenner 2009).
Currently refining and sharing these techniques with more than 25 states in the United States, testing companies (Renaissance Learning), and other countries including Australia.
About Me
Dr. Damian Betebenner, PhD
Educational Background: PhD in Education Measurement from the University of Colorado, Boulder and a PhD in Mathematics from the University of Wyoming.
Began using R in 1999 to produce high quality graphics and it has been seminal in expanding my work.
I’m more of a "data scientist" than a statistician. SGPs are more of a "data science" approach to examining student academic growth than a "statistician" approach.
History
- 2004-2007
-
Assistant Professor Boston College, ERME.
- 2005-2007
-
Began development of the Colorado Growth Model (Student Growth Percentiles).
- 2008
-
Successful application of Colorado Growth Model (criterion-referenced component) as part of growth model pilot program.
- 2009-2010
-
Began/continued work with approximately two-dozen other states on developing state growth models.
- 2010
-
Worked with states on incorporating growth into RttT applications and with successful states on their use (Massachusetts, Georgia, New York, Rhode Island).
- 2011
-
Worked with a number of states on incorporating student growth percentiles into the ESEA waiver applications and teacher evaluation systems.
- 2012
-
Worked with 5 states (including Rhode Island) on co-developing SchoolView interactive visualizations to help better communicate student growth percentile results.
- 2014
-
Built SIMEX measurement error correction into SGP model (Shang, VanIwaarden, and Betebenner 2015)
- 2014
-
Extended analyses to accommodate time-dependency allowing for SGP modelling of interim assessments.
- 2017
-
Extended SGP package to better accommodate assessment transitions.
- 2015-present
-
Work with about 20 states in different capacities to calculate SGPs.
- 2020-2023
-
Utilized SGPs to examine academic impact and recovery due to the COVID-19 pandemic.
About the growth model
The Student Growth Percentiles Methodology is a norm- and criterion-referenced growth analysis method (Damian W. Betebenner 2009).
The norm-referenced component of the model is the student growth percentile which indicates the relative growth a student makes.
The criterion-referenced component of the model is the student growth percentile target which indicates the amount of growth required by the student to reach/maintain desirable achievement goals in a specified time frame. For example, catching-up to proficiency within 3 years.
The norm- and criterion-referenced components together allow stakeholders to understand what is, what should be, and what is reasonable simultaneously.
The goal of the metric was to assist states to move beyond debates over what thermometer is best to discussions of how best to use the thermometer.
Built to maximize sharing
A number of analytic tools (for doing calculations) and visualization tools have been developed with the goal to promote maximum sharing.
Data isn’t valuable! It’s what one does with data that is potentially valuable!
The analytic tools to calculate all the quantities associated with student growth percentiles are open source and freely available to all states (Damian W. Betebenner et al. 2025). sgp.io
Conduct training sessions at national conferences to help others calculate these quantities on their own.
Build enhanced visualization and reporting systems to make data come alive to stakeholders, allow for stakeholder collaboration and sharing, and lead to better stakeholder engagement with data.
Guiding Questions
Growth models address specific questions
Different growth analysis techniques are good at answering different questions.
It is critical to understand these different questions.
Different questions lead to different conversations which lead to different uses and outcomes.
Changing conversations about education
Starting with the right questions simplifies development and motivating the proper use of the growth model results.
The questions set the table for those conversations.
Yen (2007) for an excellent list of questions derived from a survey of parent, teachers and administrators
What are the relevant questions for parents?
Yen (2007), from a state survey of parents, teachers and administrators, compiled a list of frequently voiced questions/concerns by stakeholder group.
Parent Questions
Did my child make a year’s worth of progress in a year?
Is my child growing appropriately toward meeting state standards?
Is my child growing as much in Math as Reading?
Did my child grow as much this year as last year?
What are the relevant questions for teachers?
Yen (2007), from a state survey of parents, teachers and administrators, compiled a list of frequently voiced questions/concerns by stakeholder group.
Teacher Questions
Did my students make a year’s worth of progress in a year?
Did my students grow appropriately toward meeting state standards?
How close are my students to becoming Proficient?
Are there students with unusually low growth who need special attention?
What are the relevant questions for administrators?
Yen (2007), from a state survey of parents, teachers and administrators, compiled a list of frequently voiced questions/concerns by stakeholder group.
Administrator Questions
Did the students in our district/school make a year’s worth of progress in all content areas?
Are our students growing appropriately toward meeting state standards?
Does this school/program show as much growth as that one?
Can I measure student growth even for students who do not change proficiency categories?
Can I pool together results from different grades to draw summary conclusions?
What are the relevant questions for policy makers?
Policy Maker Questions
Can/how should student growth be used in judgments of educator quality?
Can/how should student growth be used in judgments of education (e.g., school) quality?
Are students on track for career and college readiness?
What adjustments for student demographics need to be considered?
Growth & Accountability
Growth versus Status
Enthusiasm for growth in accountability stems from the belief that learning (i.e., growth) and teacher/school quality are more closely related than status (i.e., attainment).
Enthusiasm for growth also stems from its potential diagnostic uses.
Growth & Accountability
Fundamental Premise
“Good” schools/teachers sustain learning (i.e., bring about growth in student achievement) in excess of that found at “bad” schools/teachers.
The inherent believability of this premise is at the heart of current enthusiasm to incorporate growth models into accountability systems.
Note that current accountability systems (from NCLB through ESSA) invoke the same premise (with achievement substituted for growth).
“Good schools/teachers” are commonly referred to as highly effective schools/teachers.
It is critical to understand the distinction between growth and effectiveness.
Value-Added & Growth
Who or what is responsible for student
Often, analyses of student growth attempt to determine the amount of student progress/growth that can be attributed to the school or teacher.
Called Value-added analyses, these techniques attempt to estimate the teacher/school contribution to student achievement.
Value-added models quantify effectiveness—purporting to measure the impact on achievement that this school or teacher would have, on average, upon similar students assigned to them.
These models and their effectiveness claims are controversial for a number of reasons (EPI (2010), NRC/NAE (2010), Braun (2005), Rubin and Stuart (2004)).(Economic Policy Institute 2010; National Research Council and National Academy of Education 2010; Braun 2005; Rubin, Stuart, and Zanutto 2004)
Value-Added & Growth
Who or what is responsible for student
Value-added models are better described as effectiveness models than as growth models.
Value-added is an inference – a causal conclusion drawn from the data.
Value-added isn’t a type of statistical model or type of assessment.
All growth models can be used for value-added purposes but not vice-versa.
Descriptive Accountability
Accountability system results can have value without making causal inferences about school quality, solely from the results of student achievement measures and demographic characteristics. Treating the results as descriptive information and for identification of schools that require more intensive investigation of organizational and instructional process characteristics are potentially of considerable value. Rather than using the results of the accountability system as the sole determiner of sanctions for schools, they could be used to flag schools that need more intensive investigation to reach sound conclusions about needed improvements or judgments about quality (Linn 2008, 21).
Describing Student Growth
The concept of student growth isn’t as difficult to understand and popular perception suggests.
Calculations may be complicated but knowing how to calculate student growth is not synonymous with understanding student growth:
Thenumber (pi=3.14159…)is difficult to calculate but is simple to understand conceptually.
Height and weight percentiles associated with children are difficult to calculate but are simple to understand conceptually.
Computational details are important but often obscure a simple conceptual basis.
Describing Student Growth
Measuring student growth, even with a vertical scale, is not a simple task.
Some believe a vertical scale simplifies the task of measuring student growth.
Even with an interval (or ratio) scale, growth is not easy to interpret. Consider, for example, height.
A child might grow 4 inches between ages 3 and 4.
4 inches is a well understood quantity.
The 4 inch increase becomes really meaningful only when understood alongside the growth of other 3 to 4 year olds.
Student growth percentiles were developed to provide a normative context for describing student growth.
The Illusion of Vertical Scales
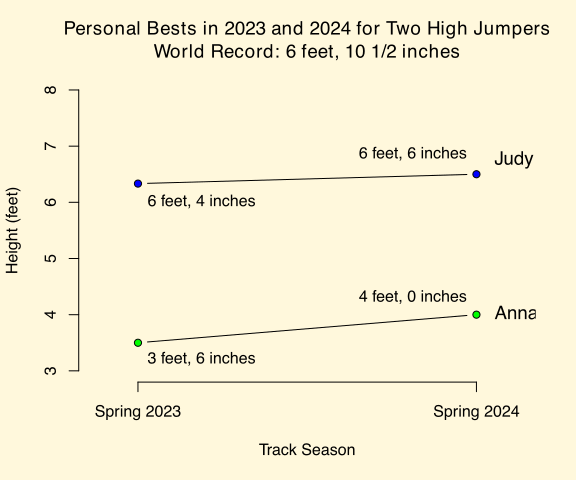
Whose high jump changed more? Explain your answer.
Whose high jump change is more remarkable? Explain your answer.
Which high jumper improved more? Explain your answer.
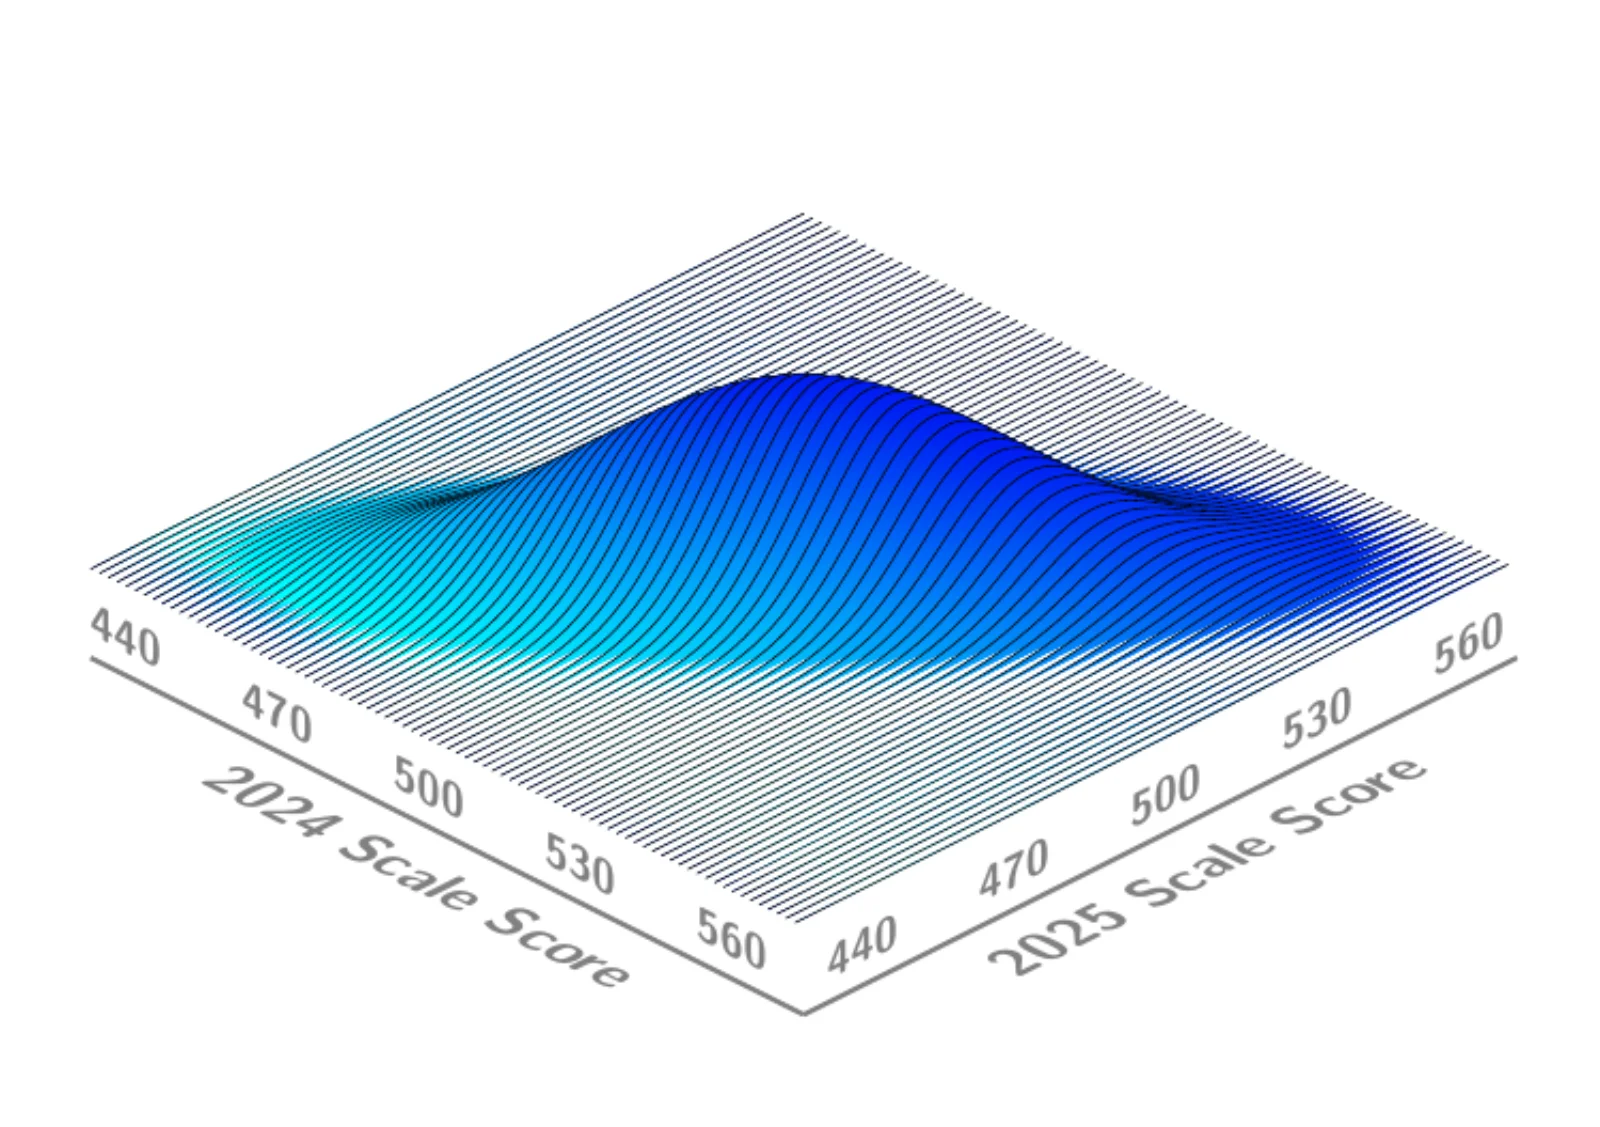
Joint Distribution of 2024 and 2025 Scale Scores
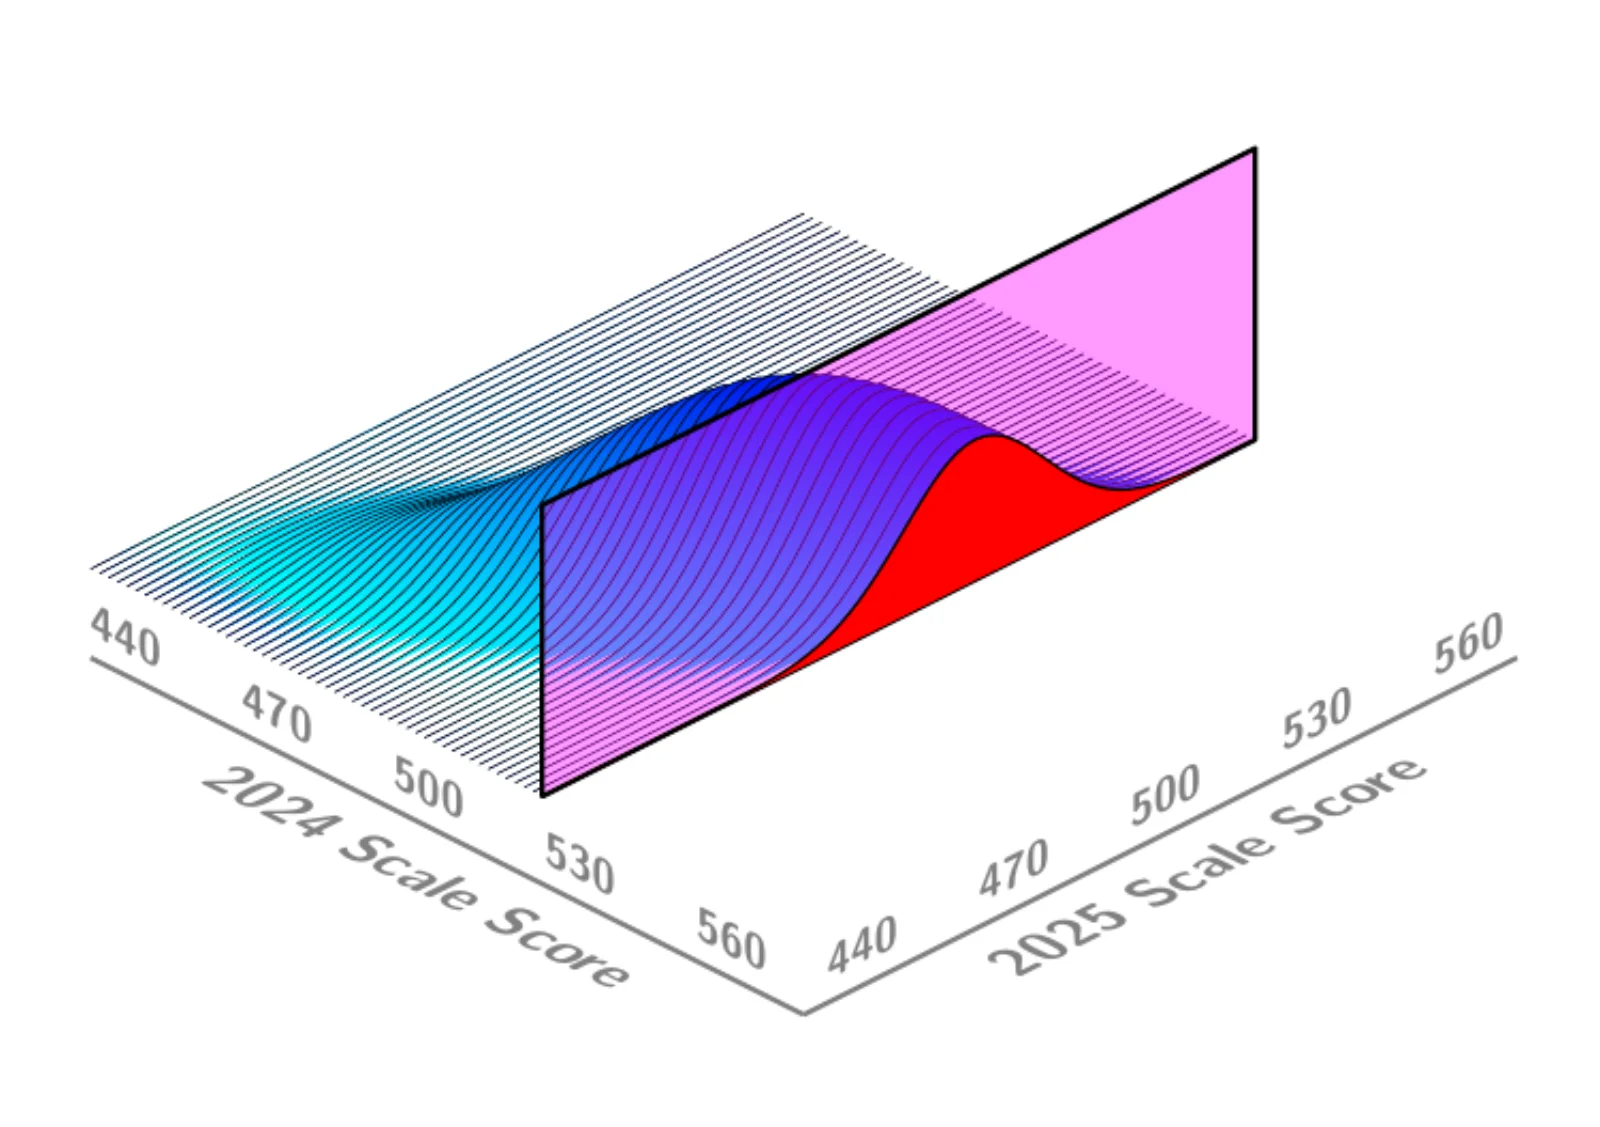
Conditioning on a 2024 Scale Score
Locating a Student’s 2025 Score
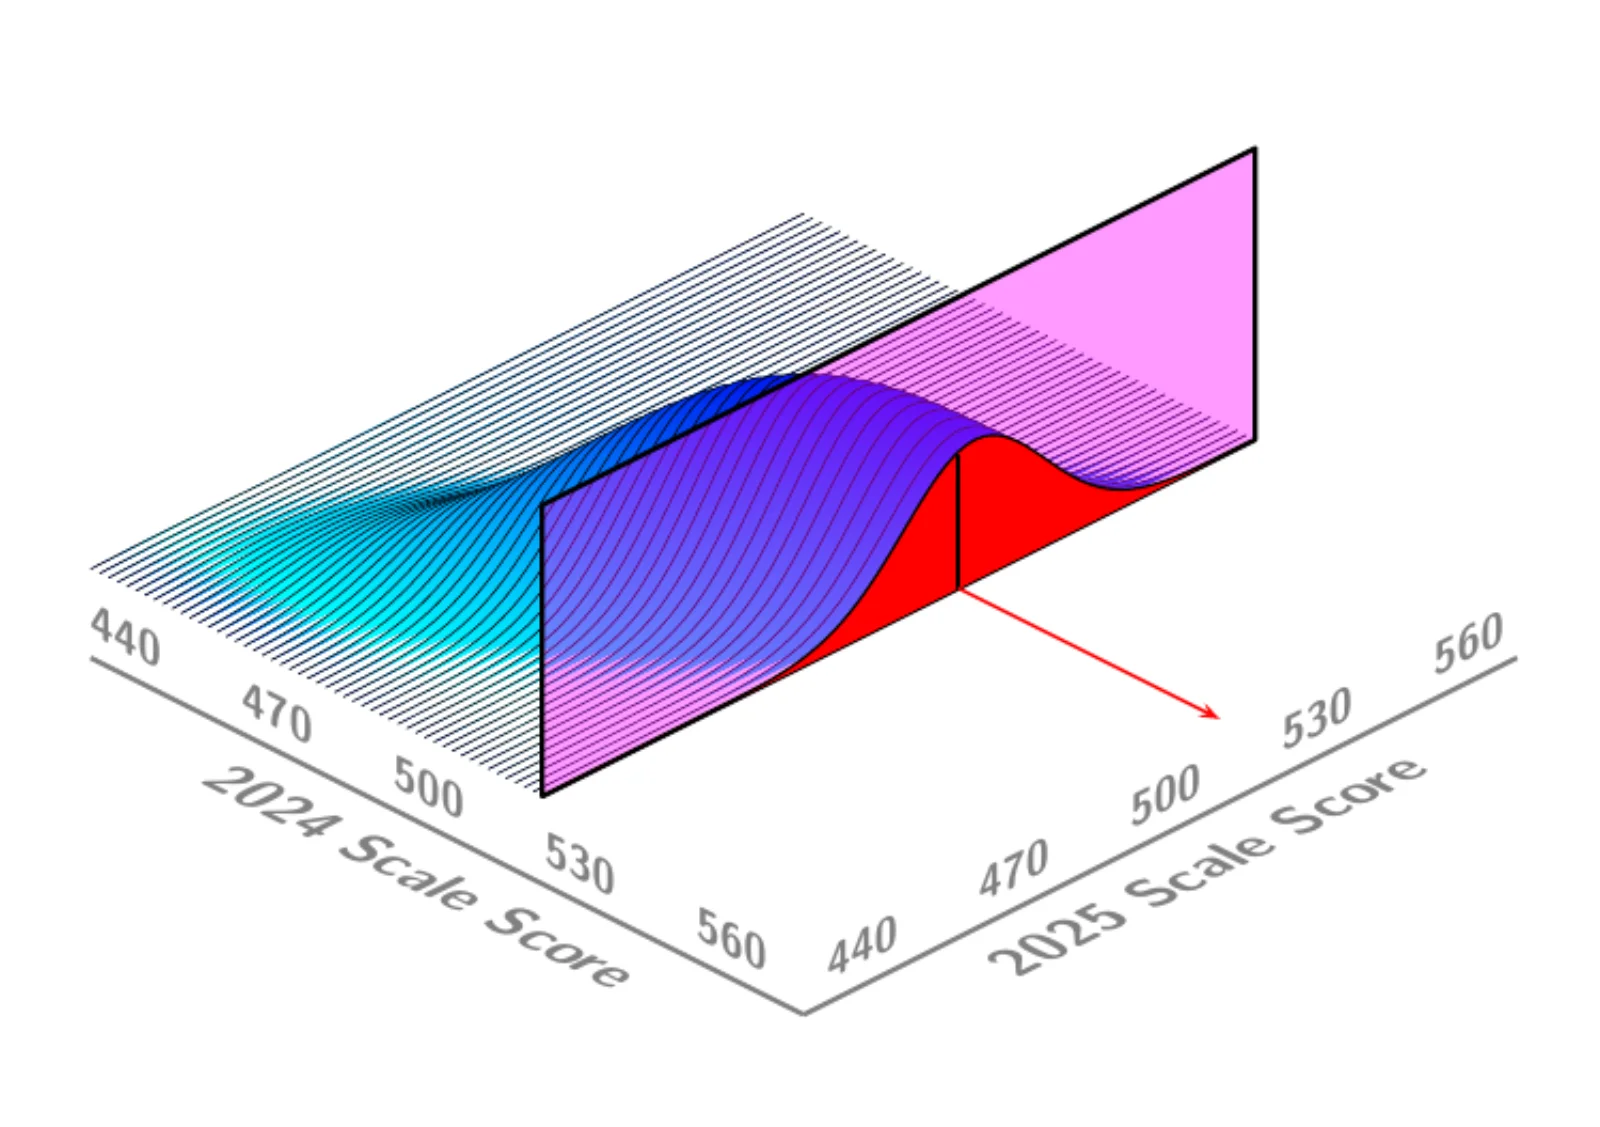
40th Percentile Growth
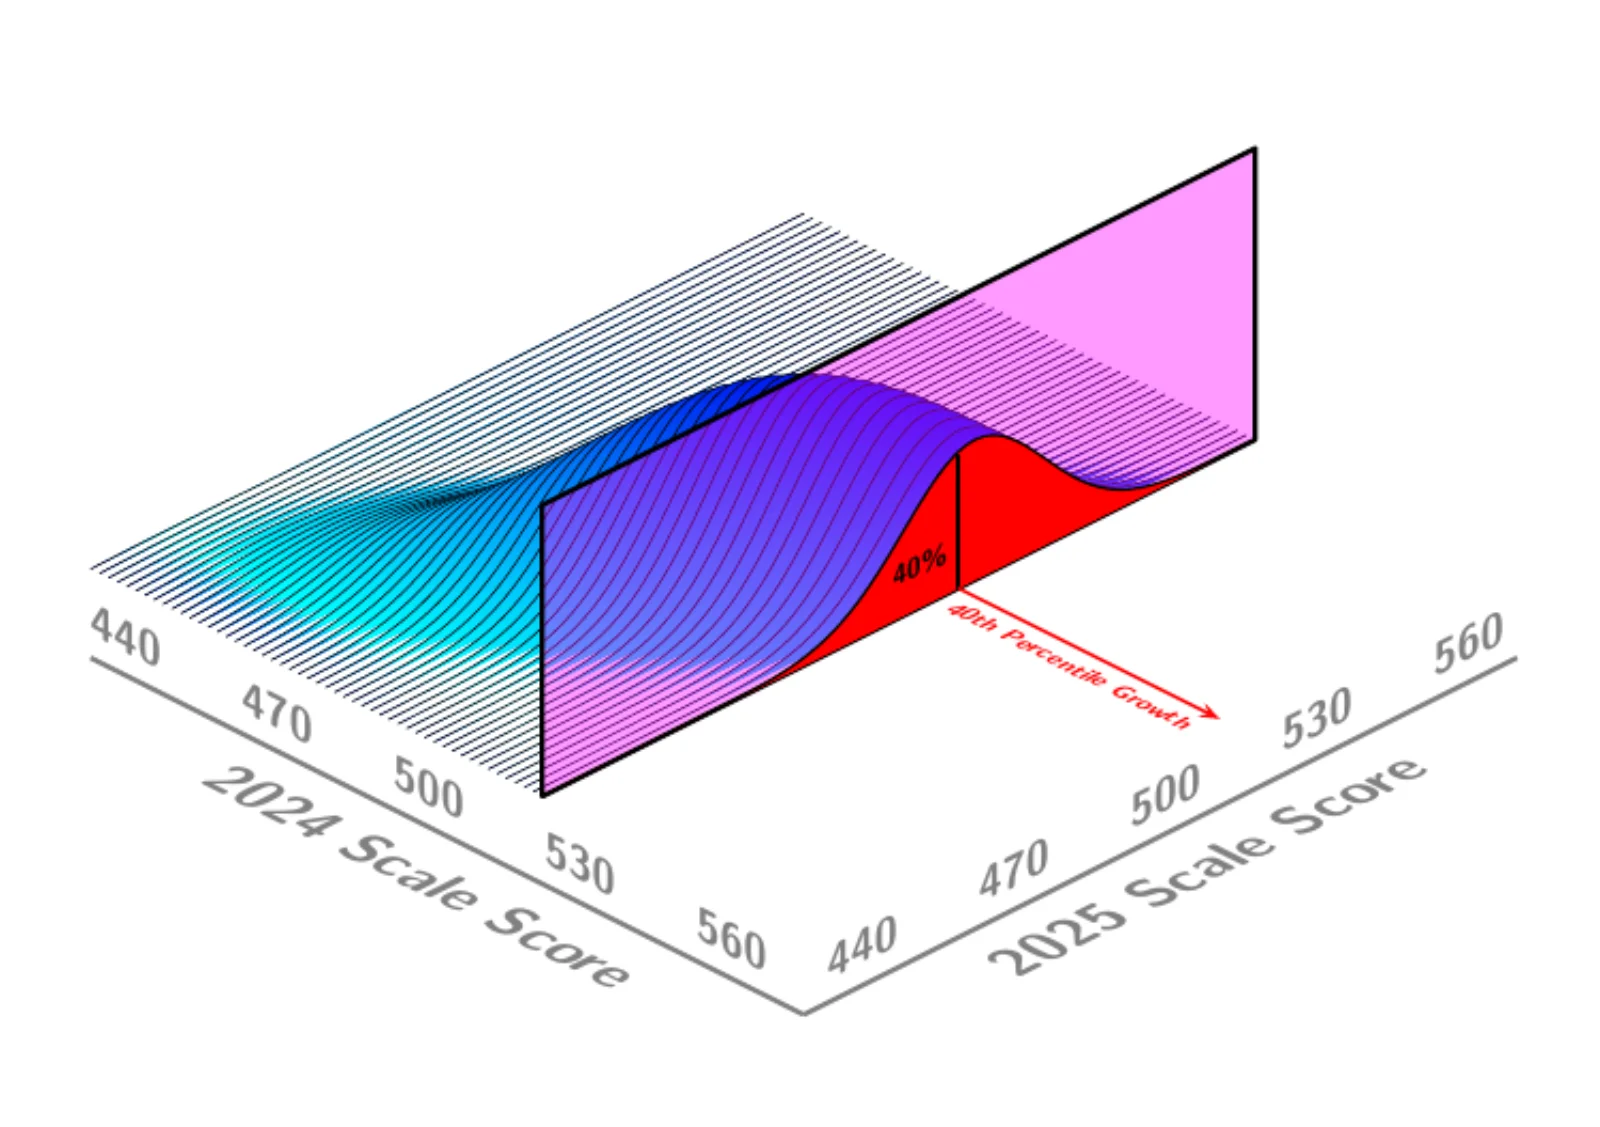
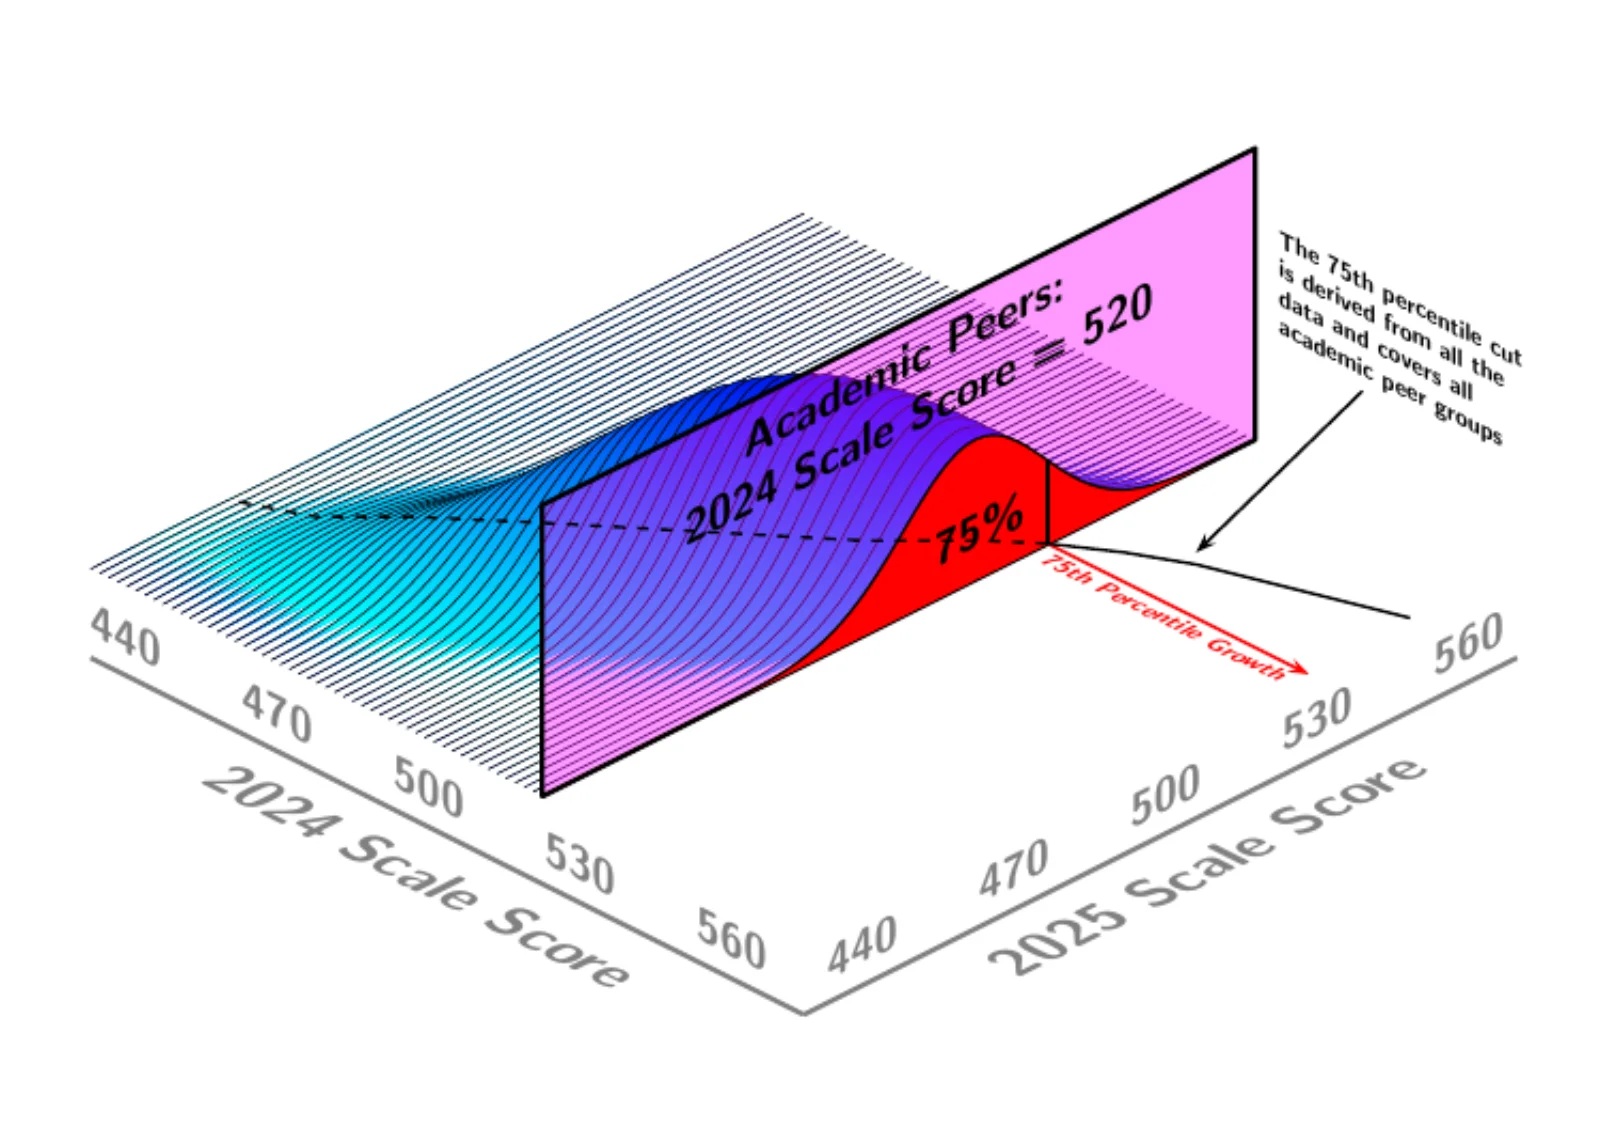
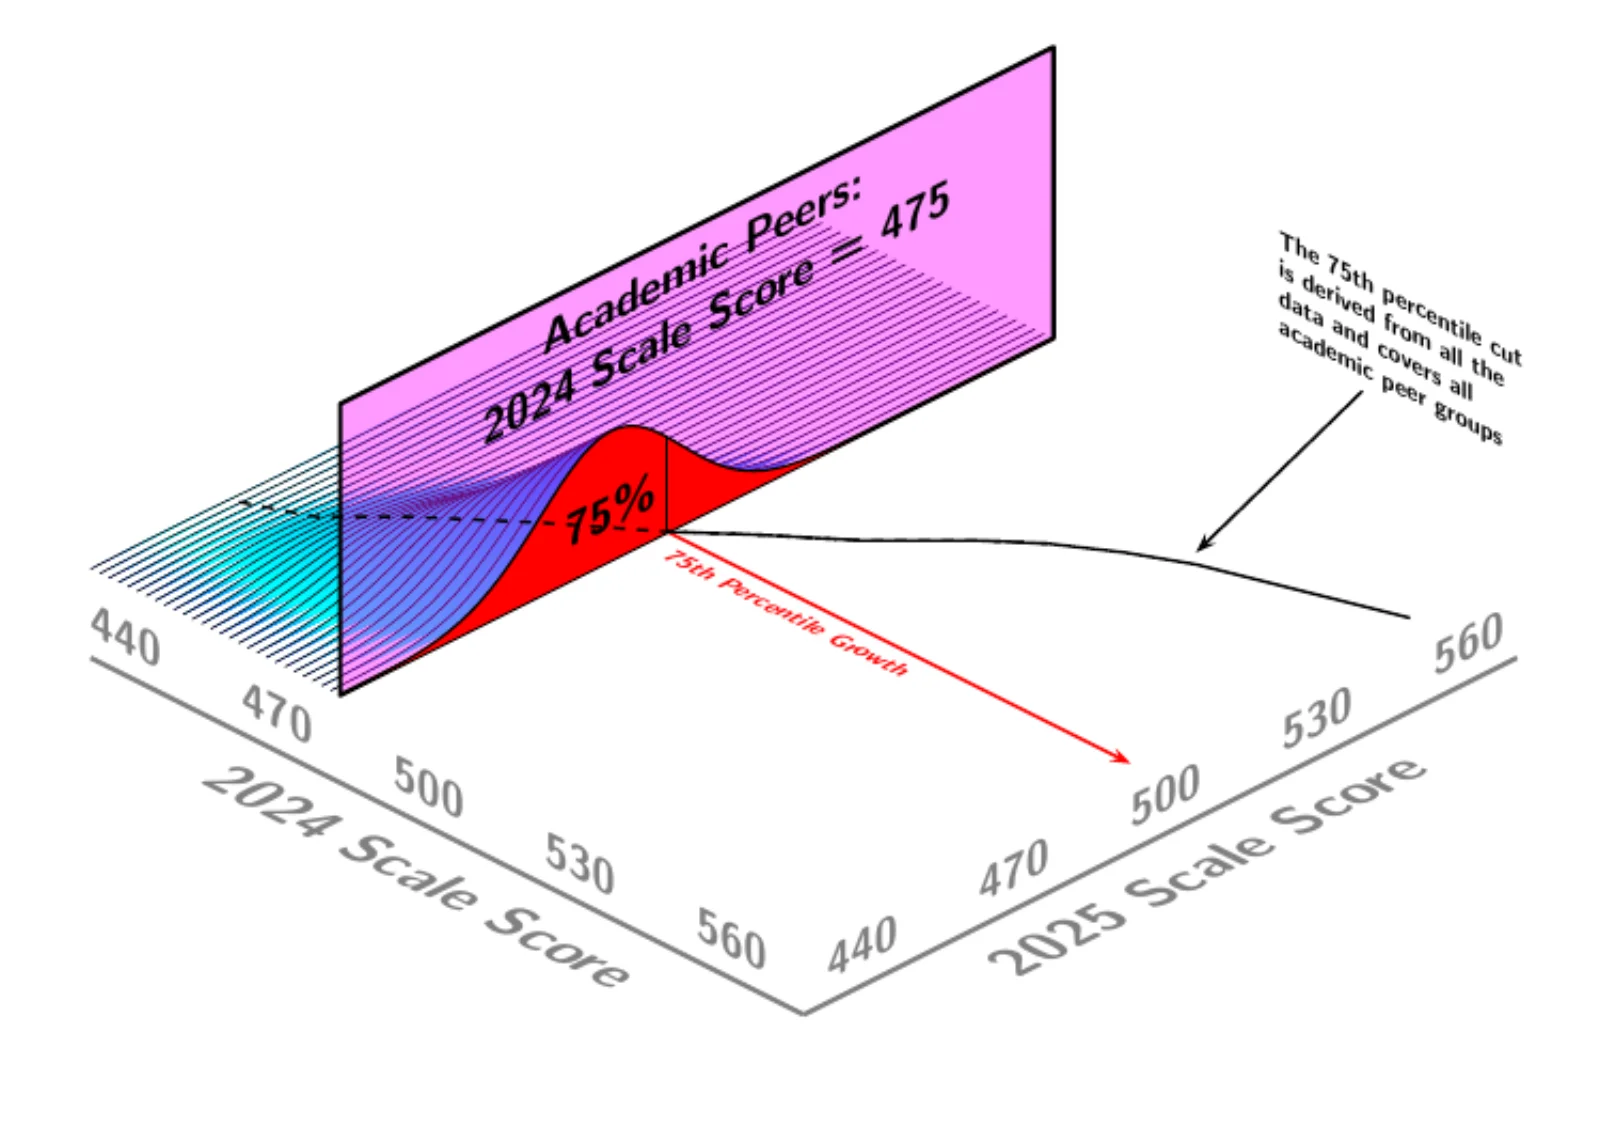
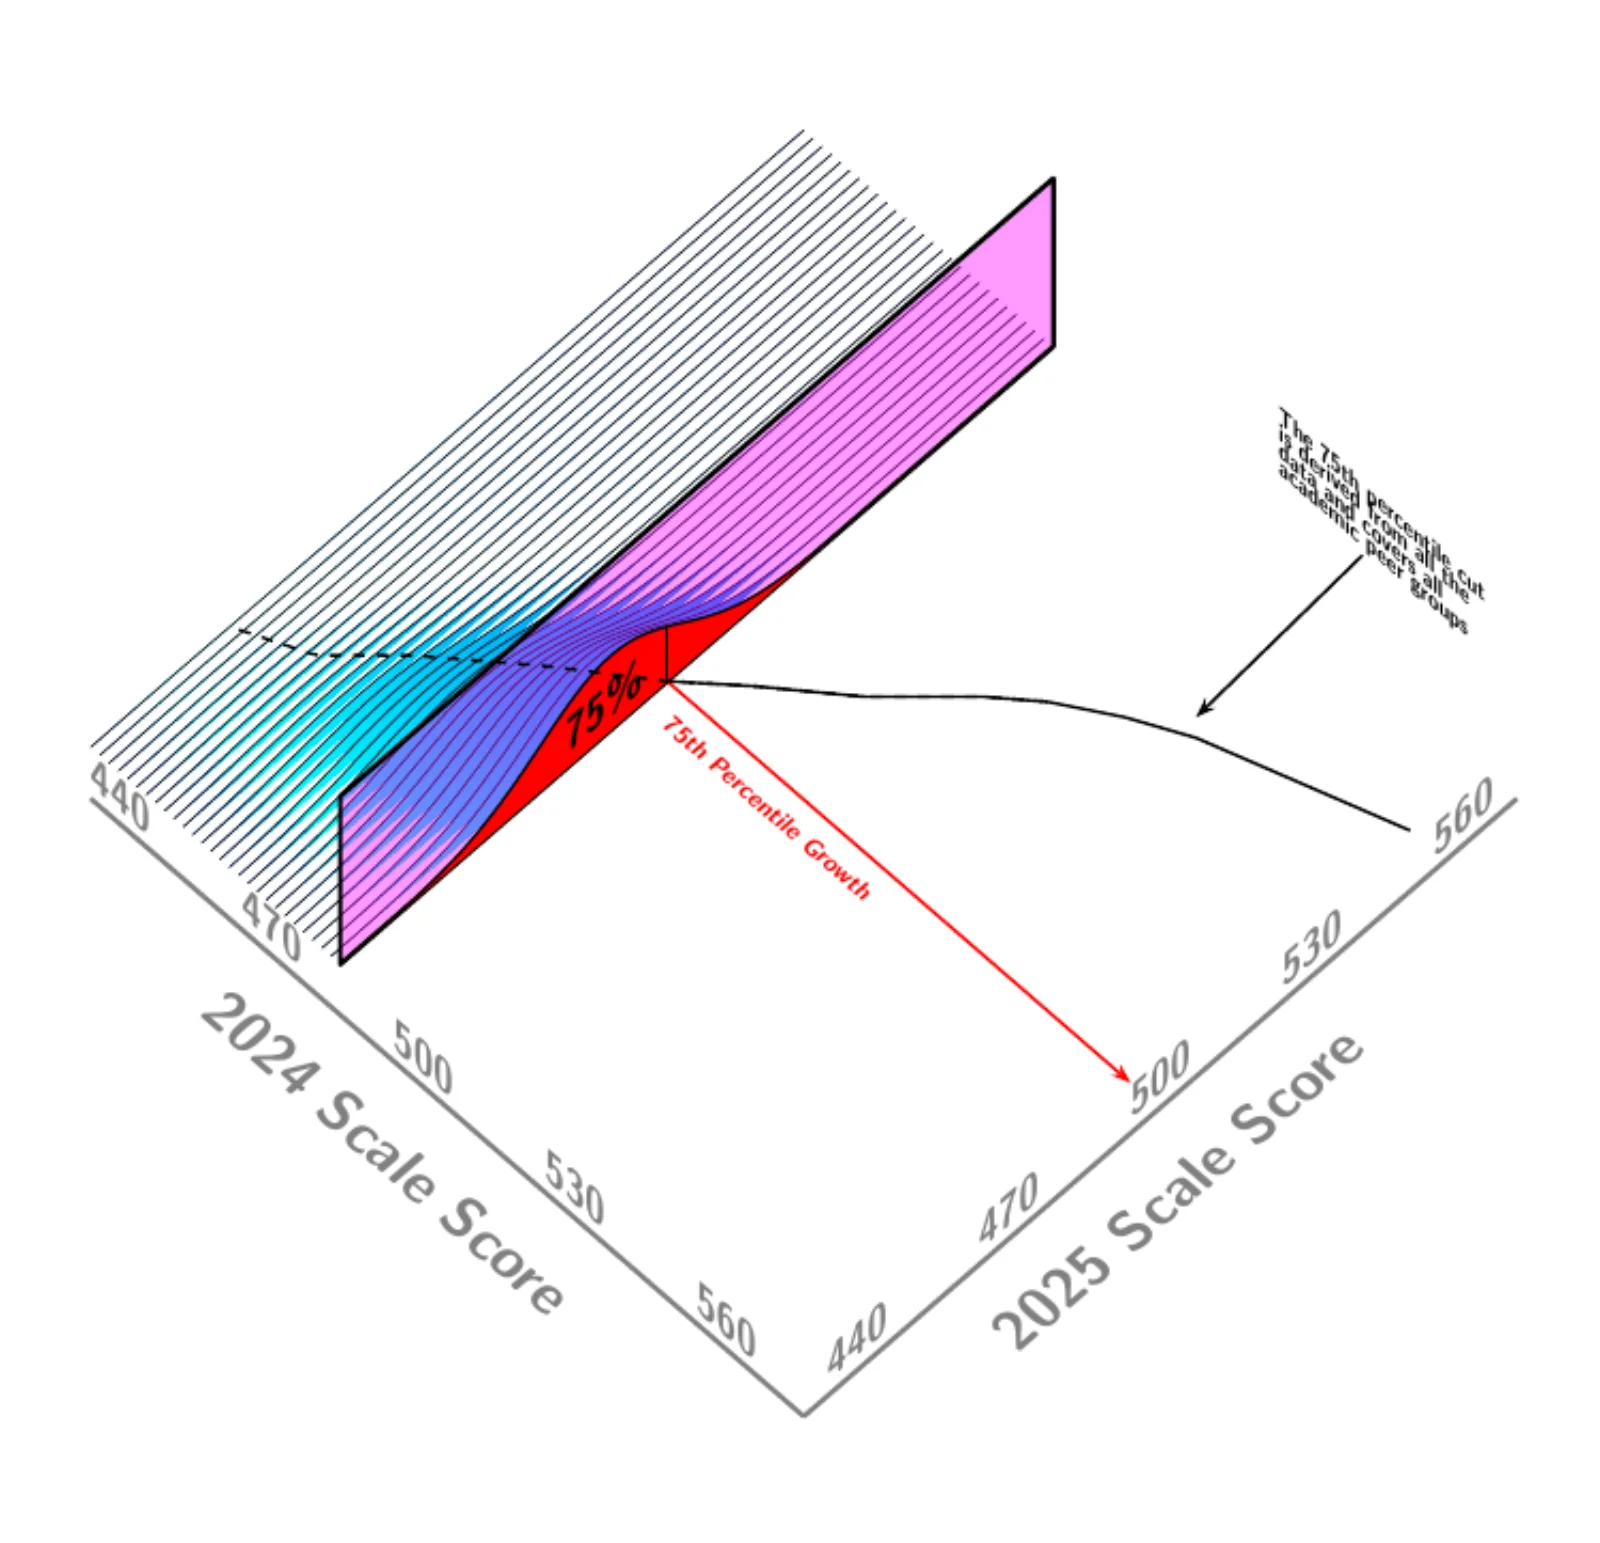
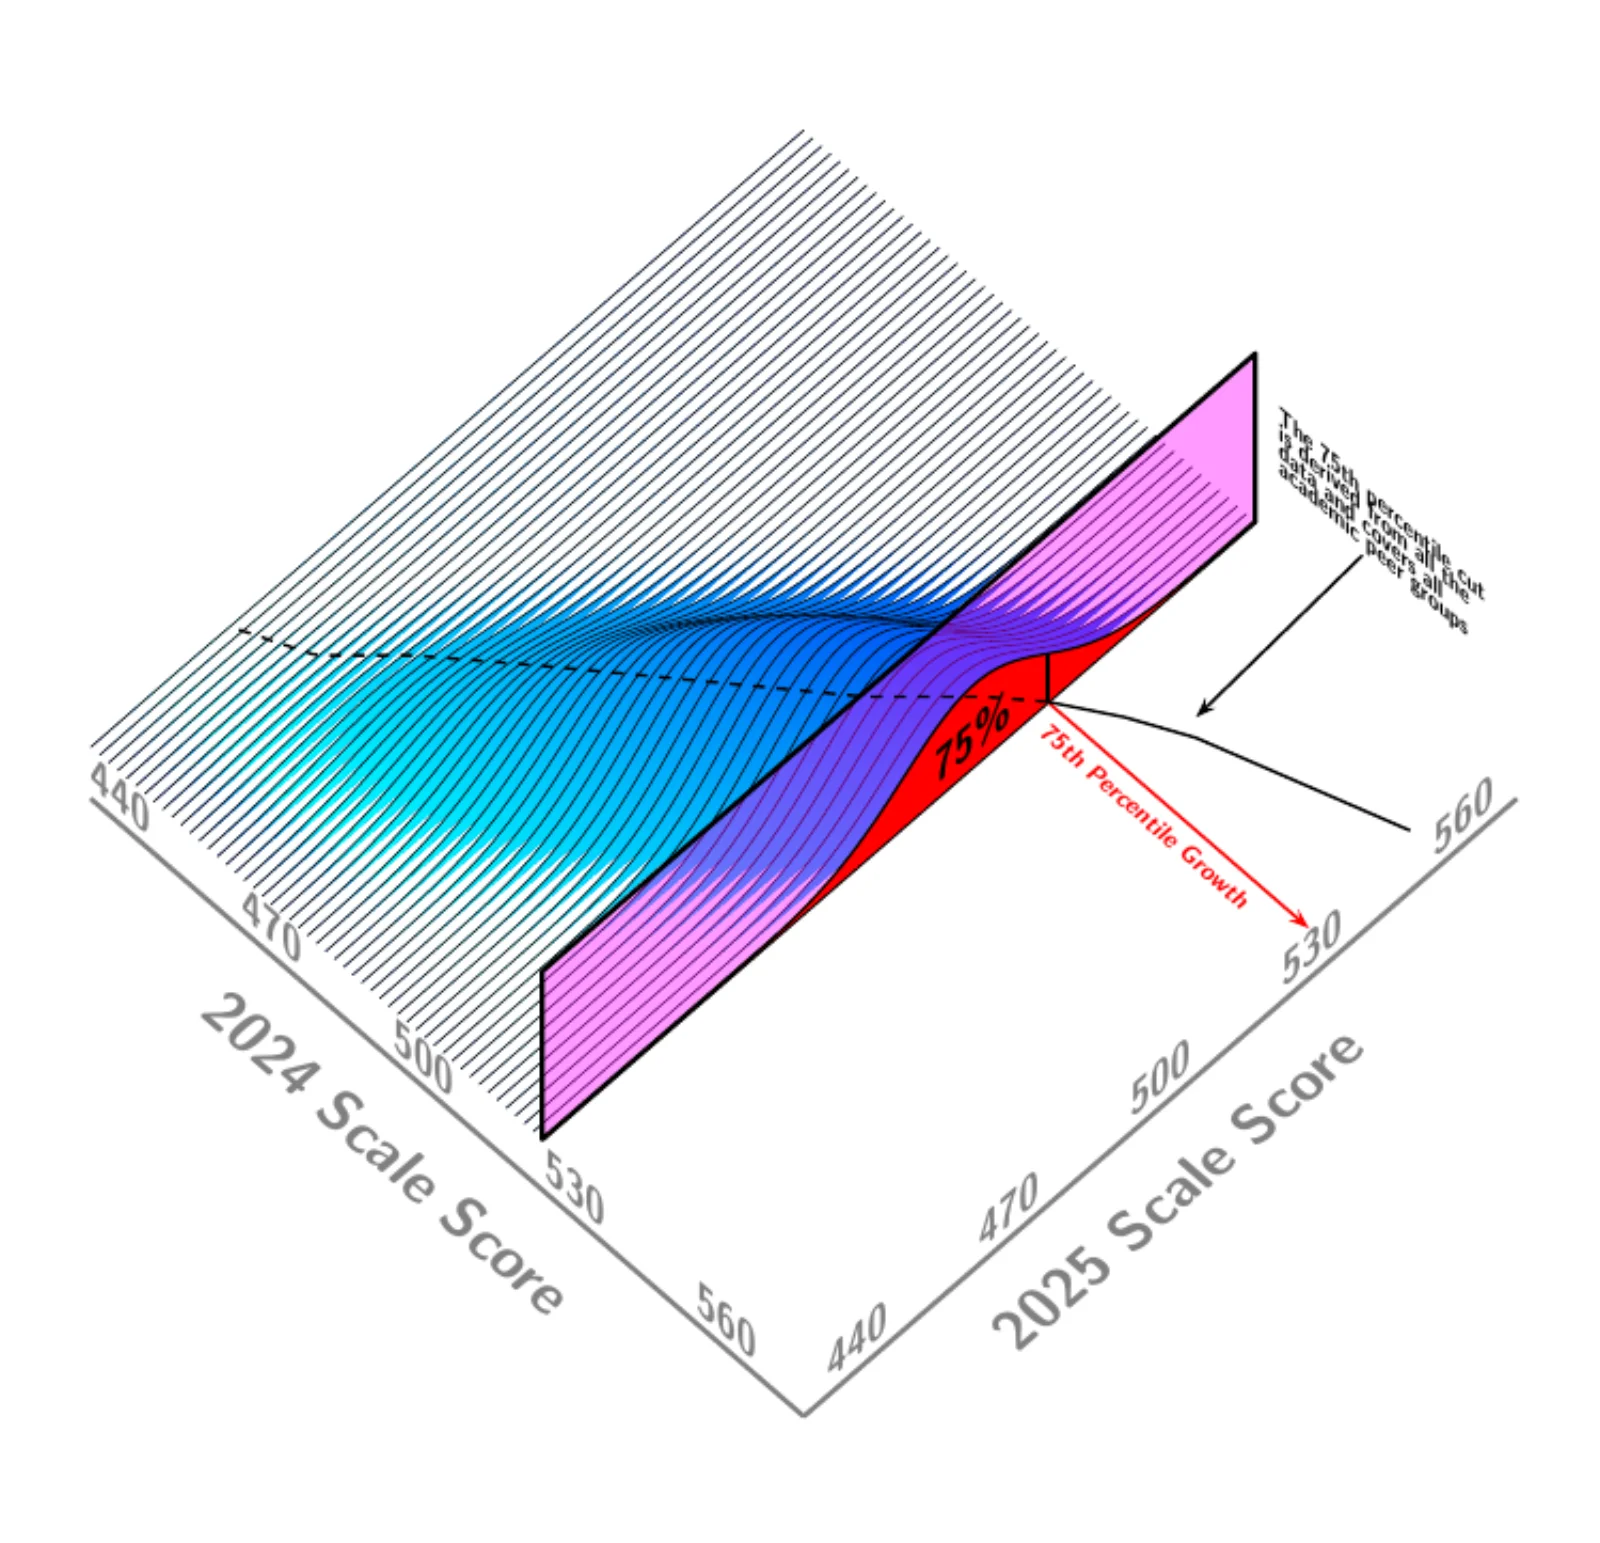
75th Percentile Growth
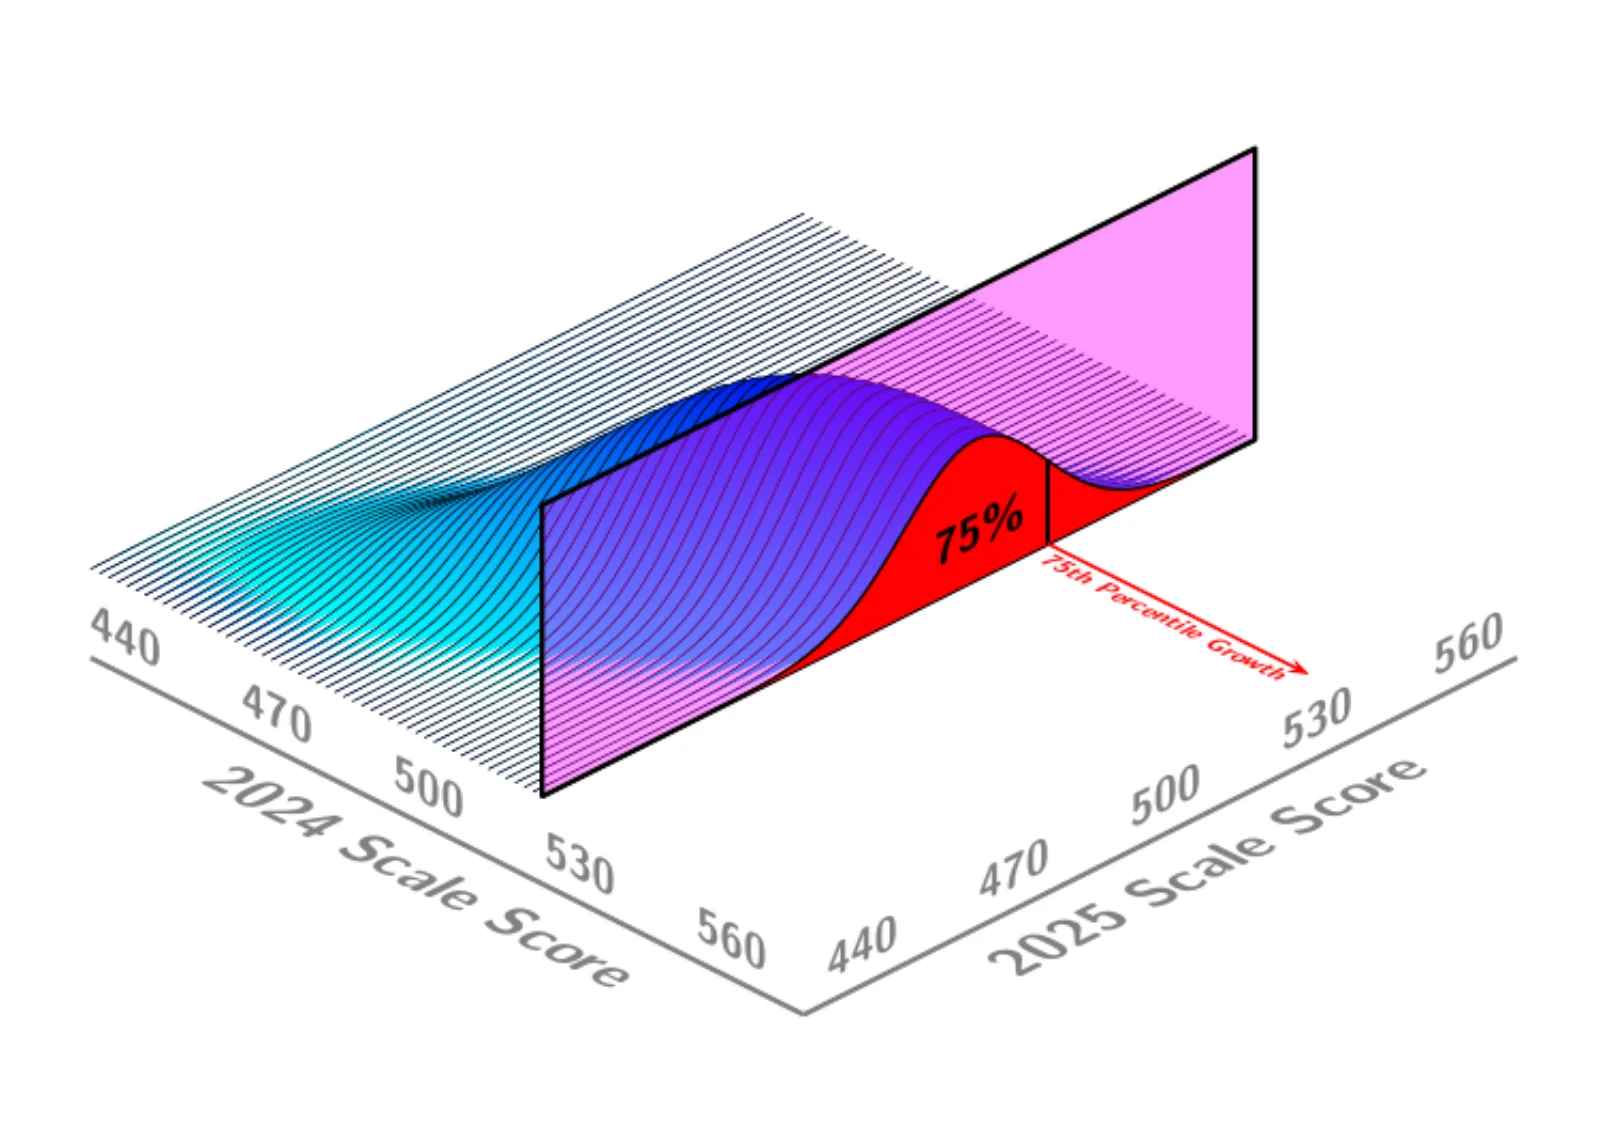
Academic Peers
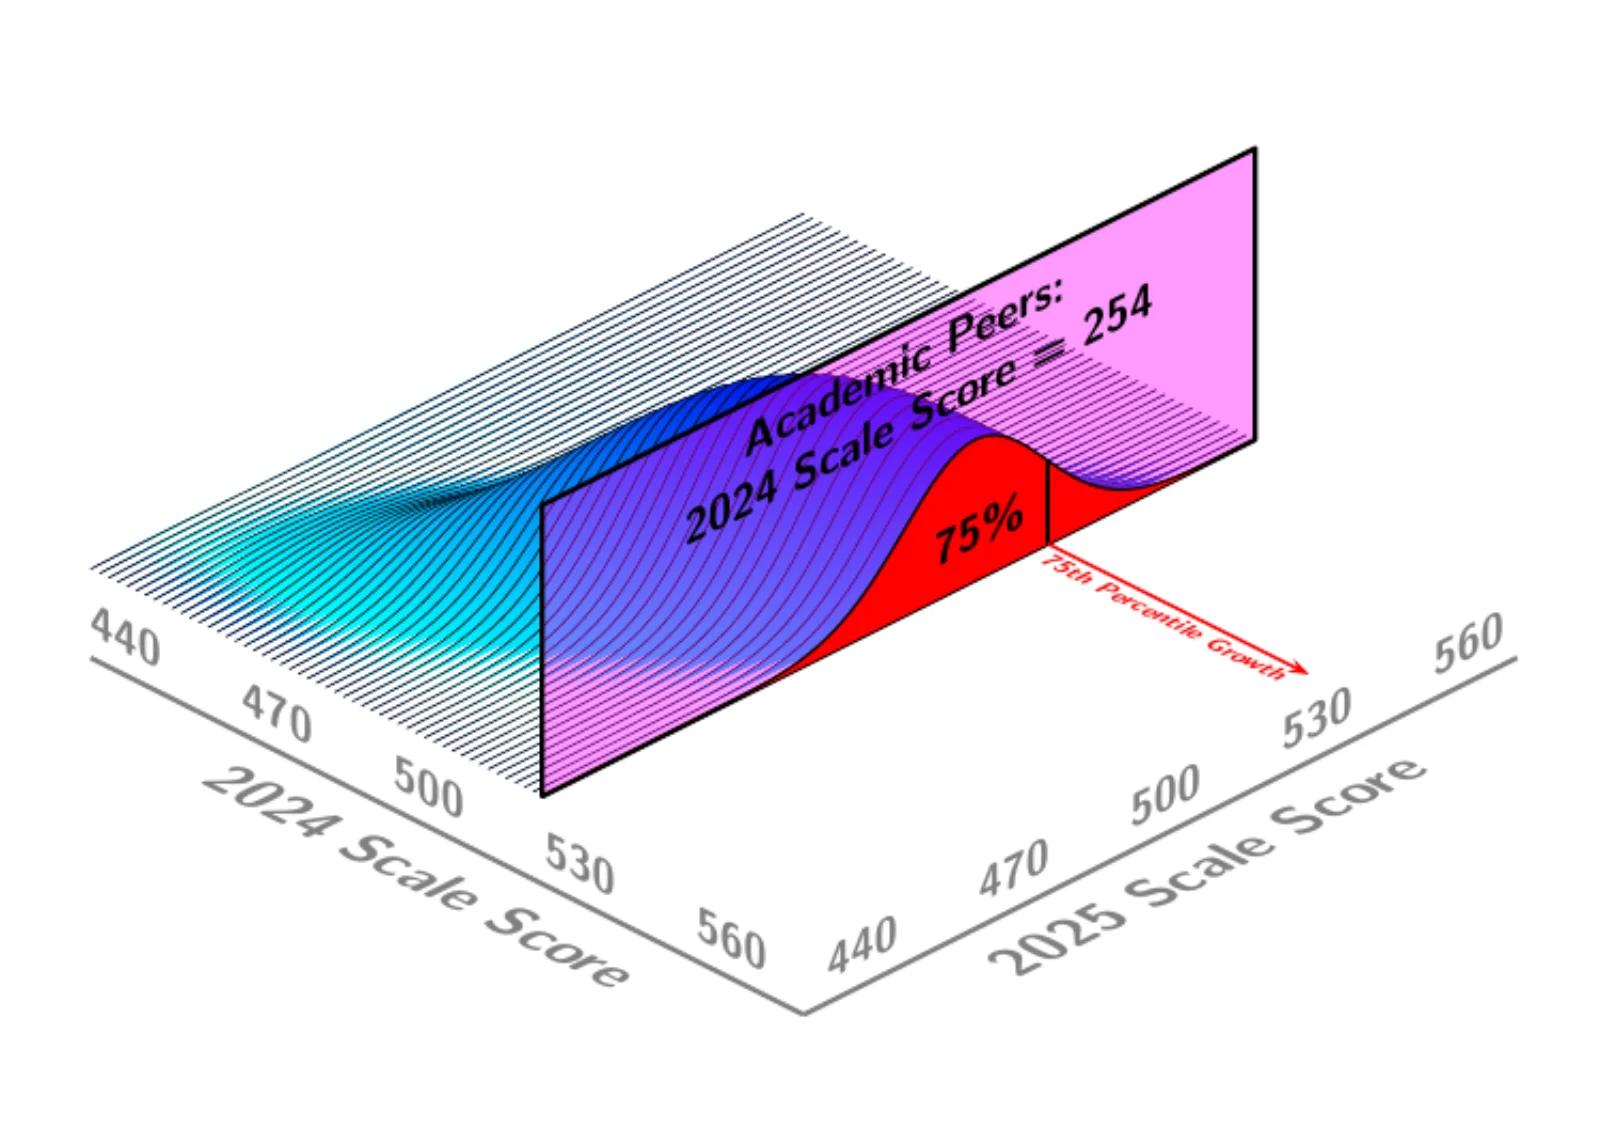
Academic Peers: 2024 Scale Score = 520
Academic Peers: 2024 Scale Score = 475
The 75th Percentile Across Academic Peer Groups
The 75th Percentile Across Academic Peer Groups
Student Growth Percentiles
Should we be surprised with a child’s current achievement given their prior achievement?
Given a student’s prior scale scores and the associated conditional density, their current scale score corresponds to a percentile of that conditional distribution.
This percentile is the student’s growth percentile.
Growth percentiles are closely related to estimating the probability of observing a student’s current achievement taking account of their past achievement:
As such, growth percentiles describe the rarity of a student’s current achievement conditional upon their prior achievement.
Student Growth Percentiles
Should we be surprised with a child’s current achievement given their prior achievement?
Student growth percentiles answer this question.
Consider a low achieving student with 90th percentile growth and a high achieving student with 10th percentile growth.
The low achieving student grew at a rate exceeding 90 percent of similar students.
The high achieving student grew at a rate exceeding just 10 percent of similar students.
The low achiever’s growth is more exemplary (probabilistically) than the high achiever’s.
Judgments about the adequacy of student growth require external criteria.
Model for Student Growth Percentiles
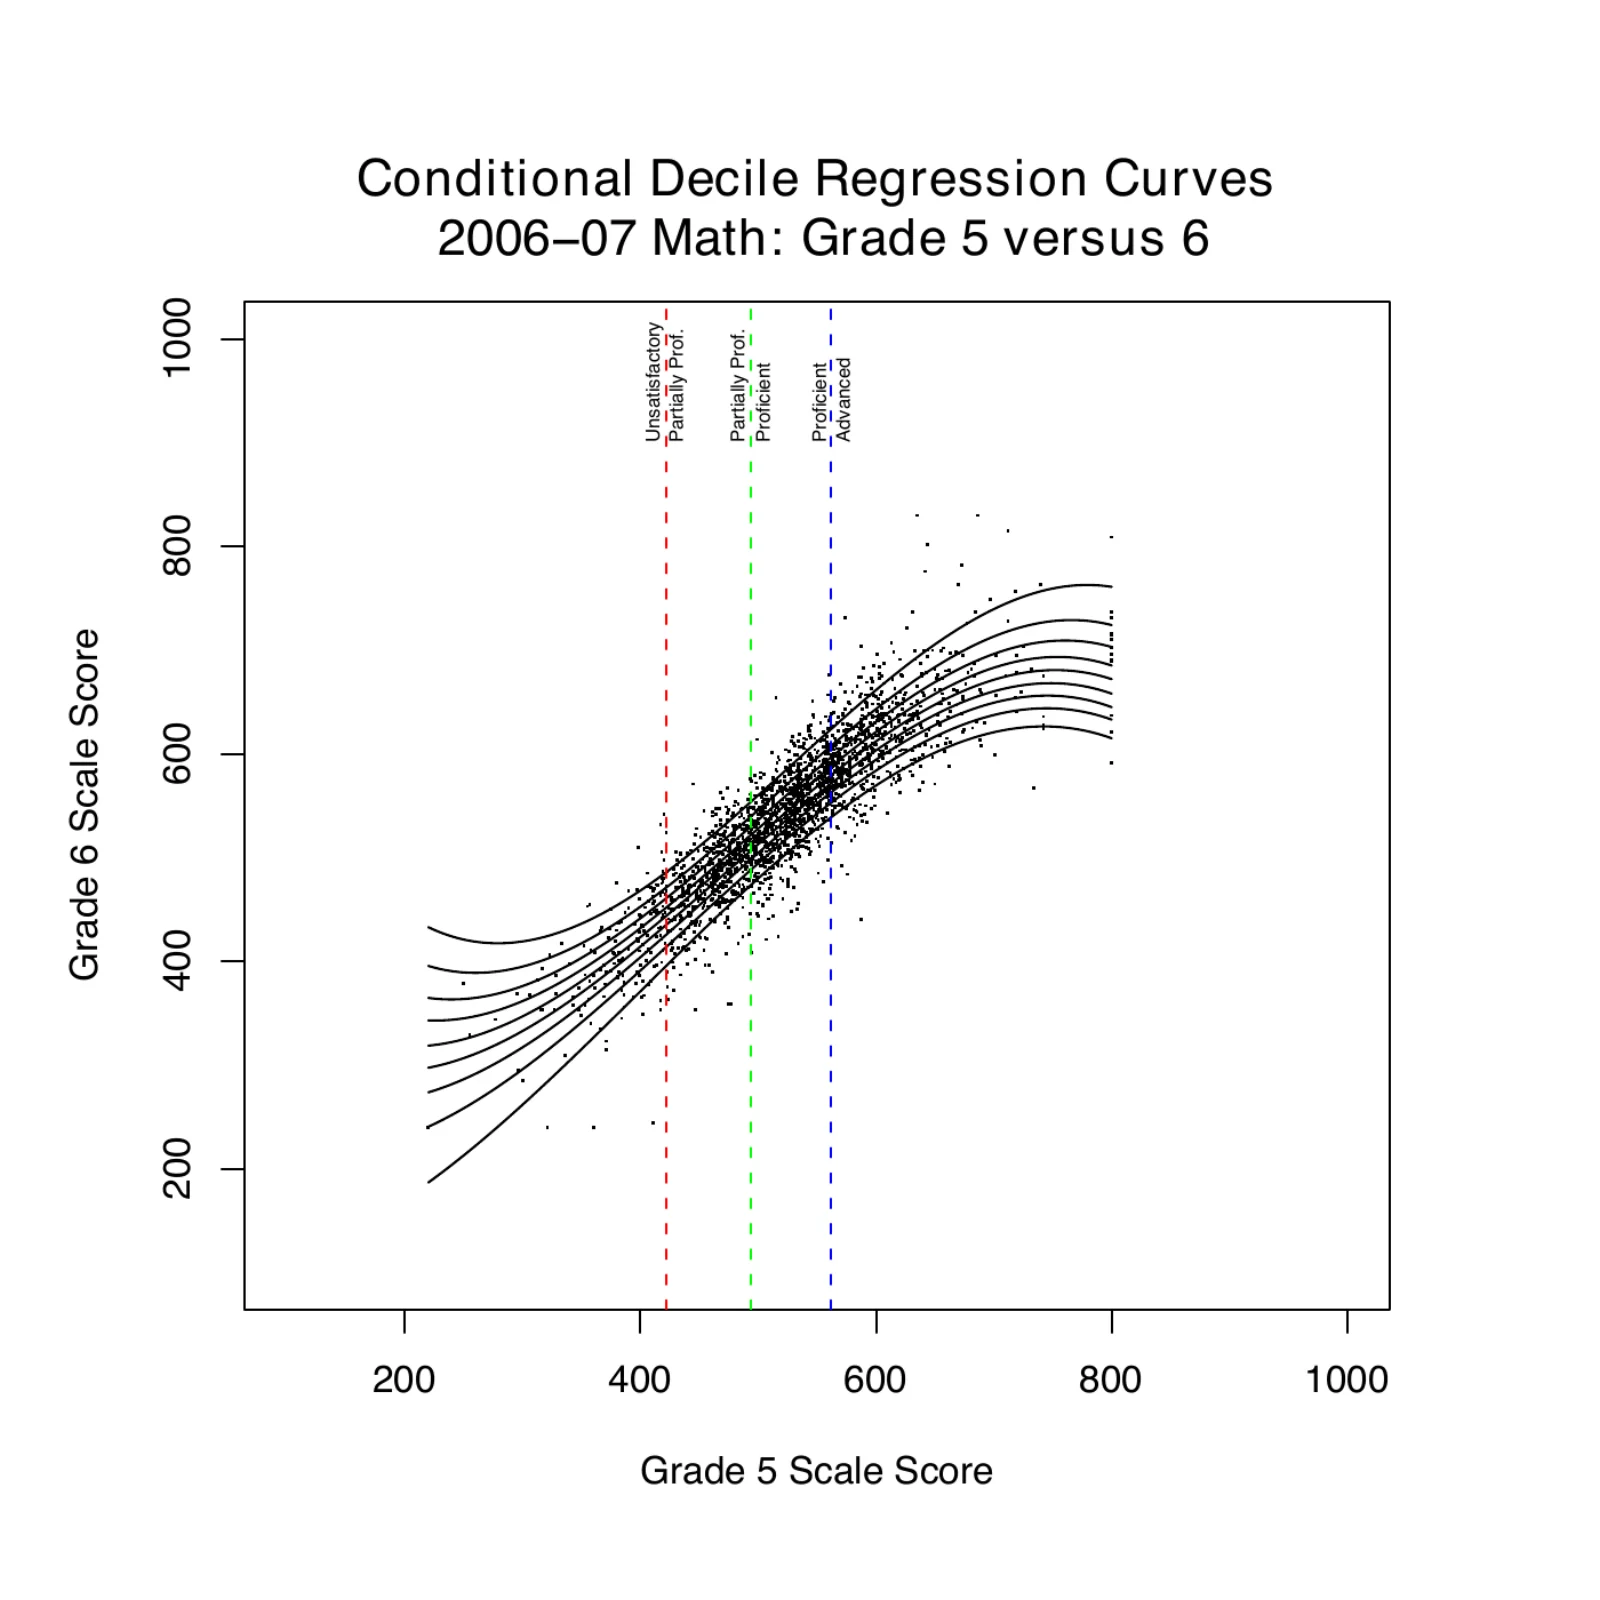
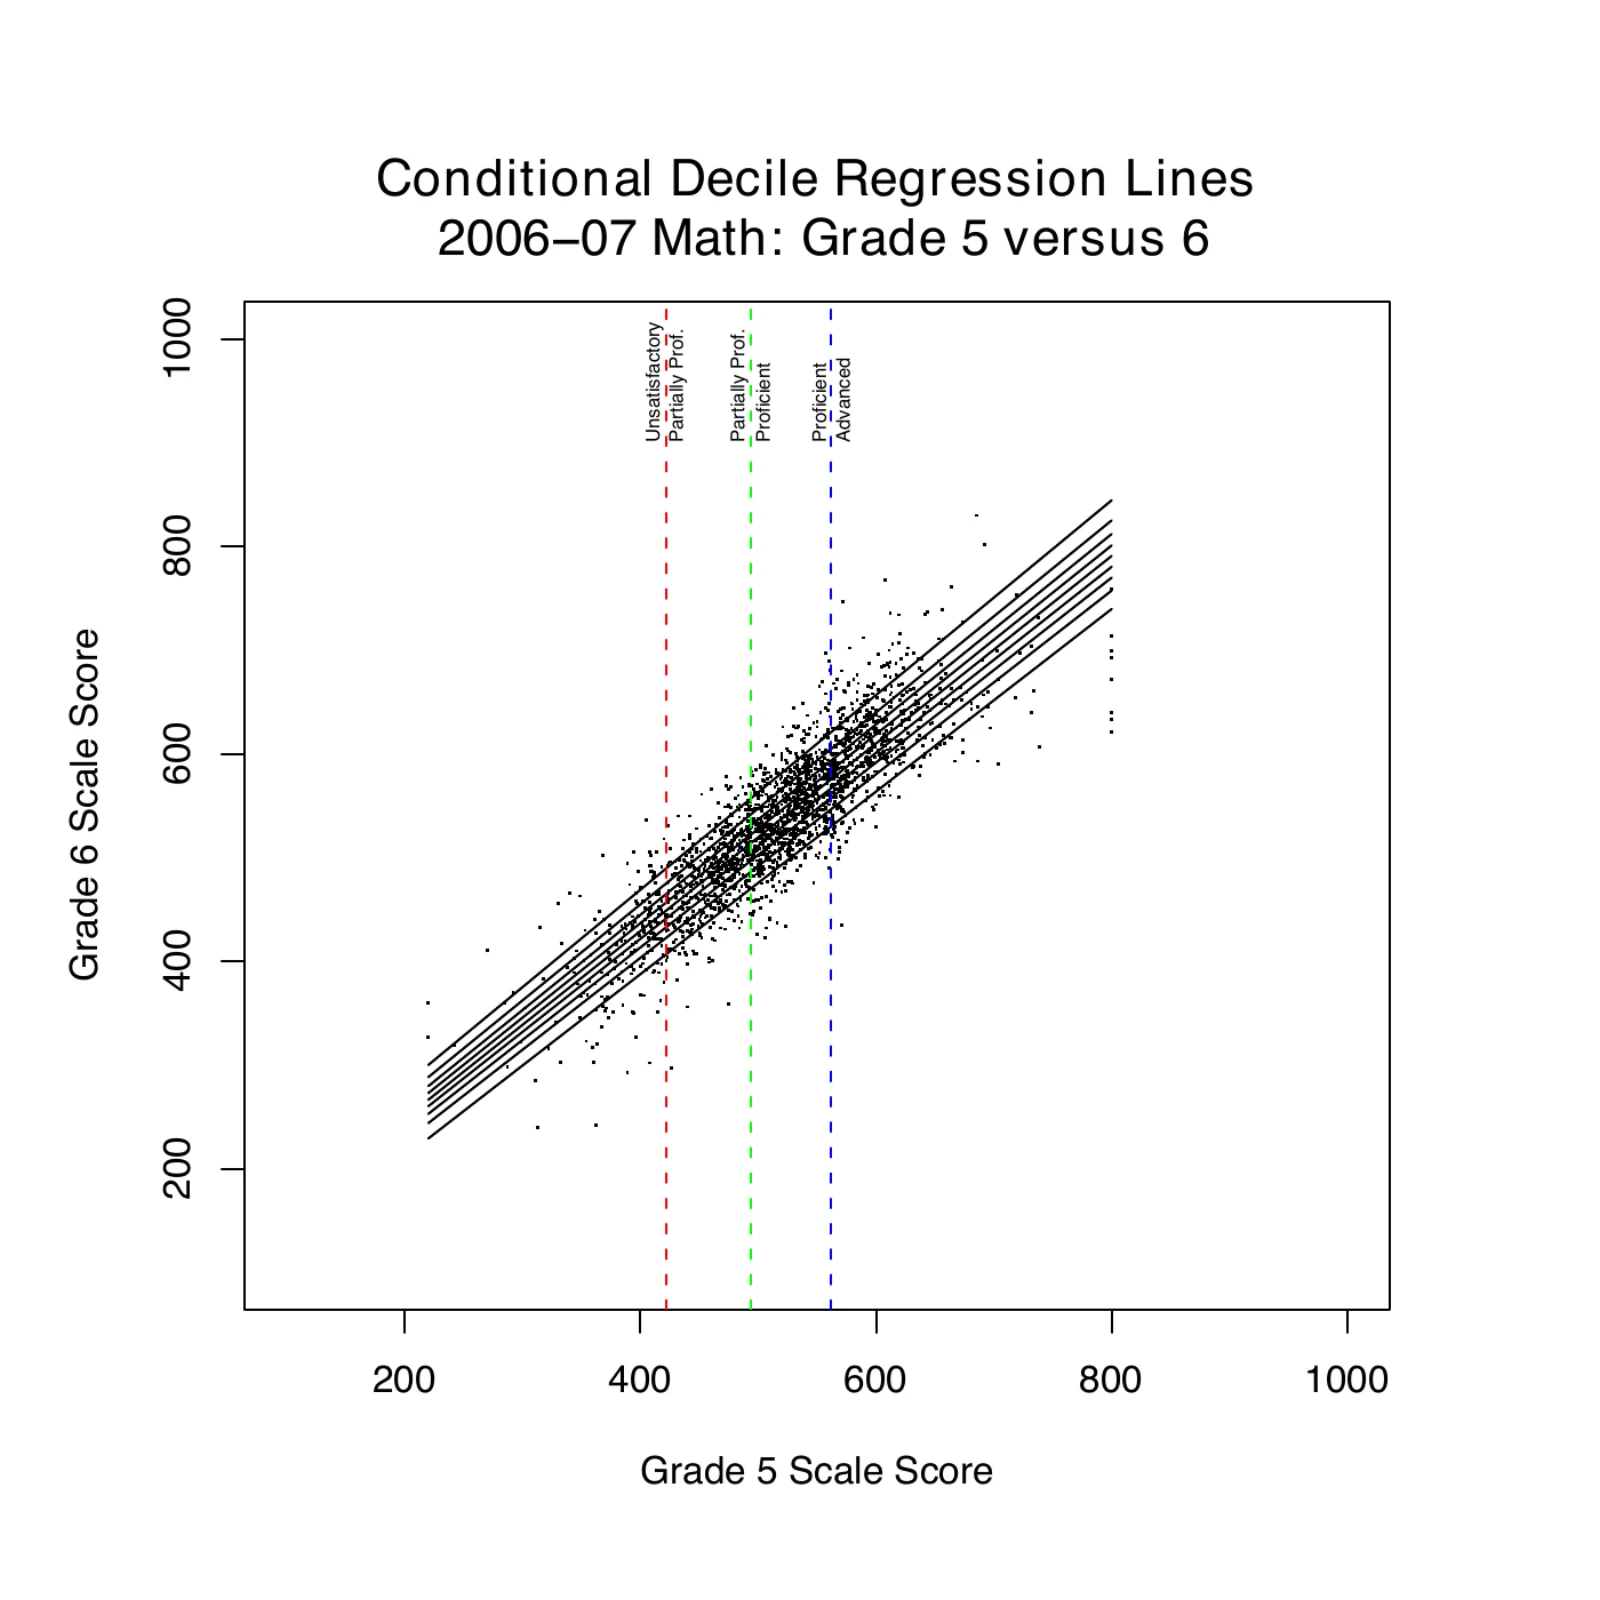
Student growth percentiles are calculated using quantile regression with B-spline smoothing, a generalized additive model.
Quantile regression is used to model the complete distribution of the response variable (current achievement)
B-spline smoothing is uses to accommodate non-linearity and heteroscedasticity of the data.
The model/method is descriptive and all about data fit—it’s a data mining procedure.
The model quantifies probabilistically.
Model for Student Growth Percentiles
Establishing growth-standards based upon growth-norms
The most common adequacy criterion are judging growth toward an achievement goal like proficiency, English Language master (i.e., growth-to-standard).
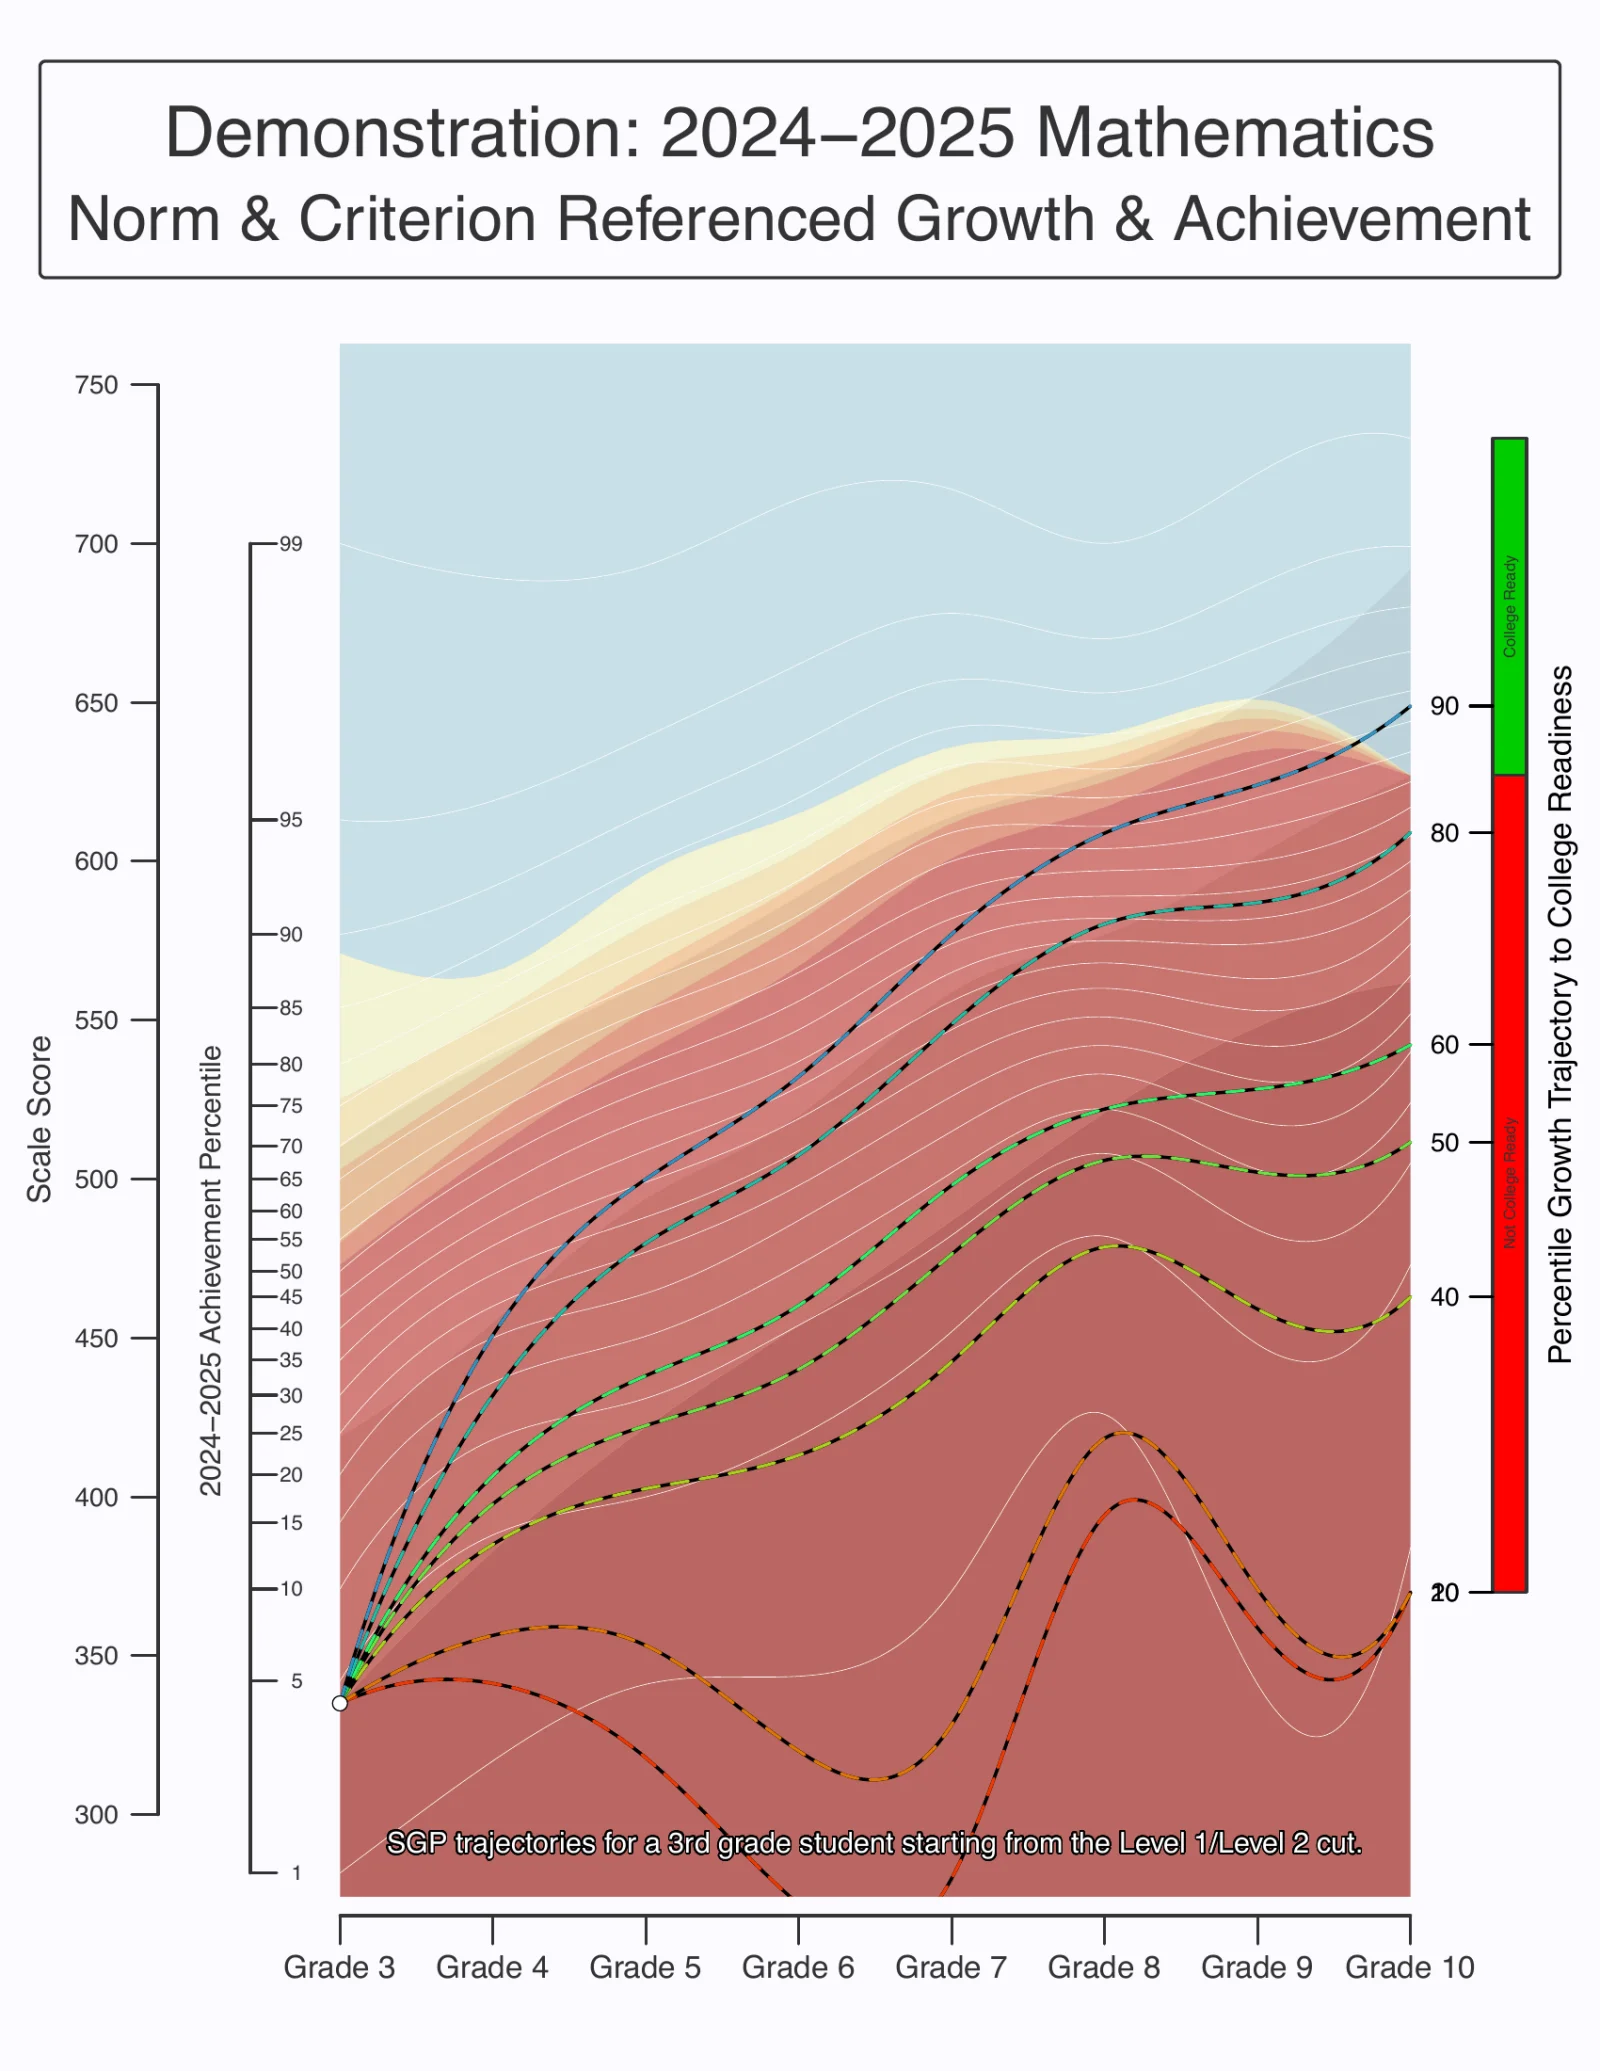
Results from student growth percentile analyses can be used to calculate percentile growth trajectories for each student.
These trajectories indicate what future rates of growth will lead to and are used to make adequacy judgments.
This growth-to-standard approach was approved as part of Colorado’s successful application to the Growth Model Pilot Program.
Growth-to-standard is most often used for English Language Proficiency testing (e.g., WIDA-ACCESS in Massachusetts)
Demonstration Student Growth and Achievement Report
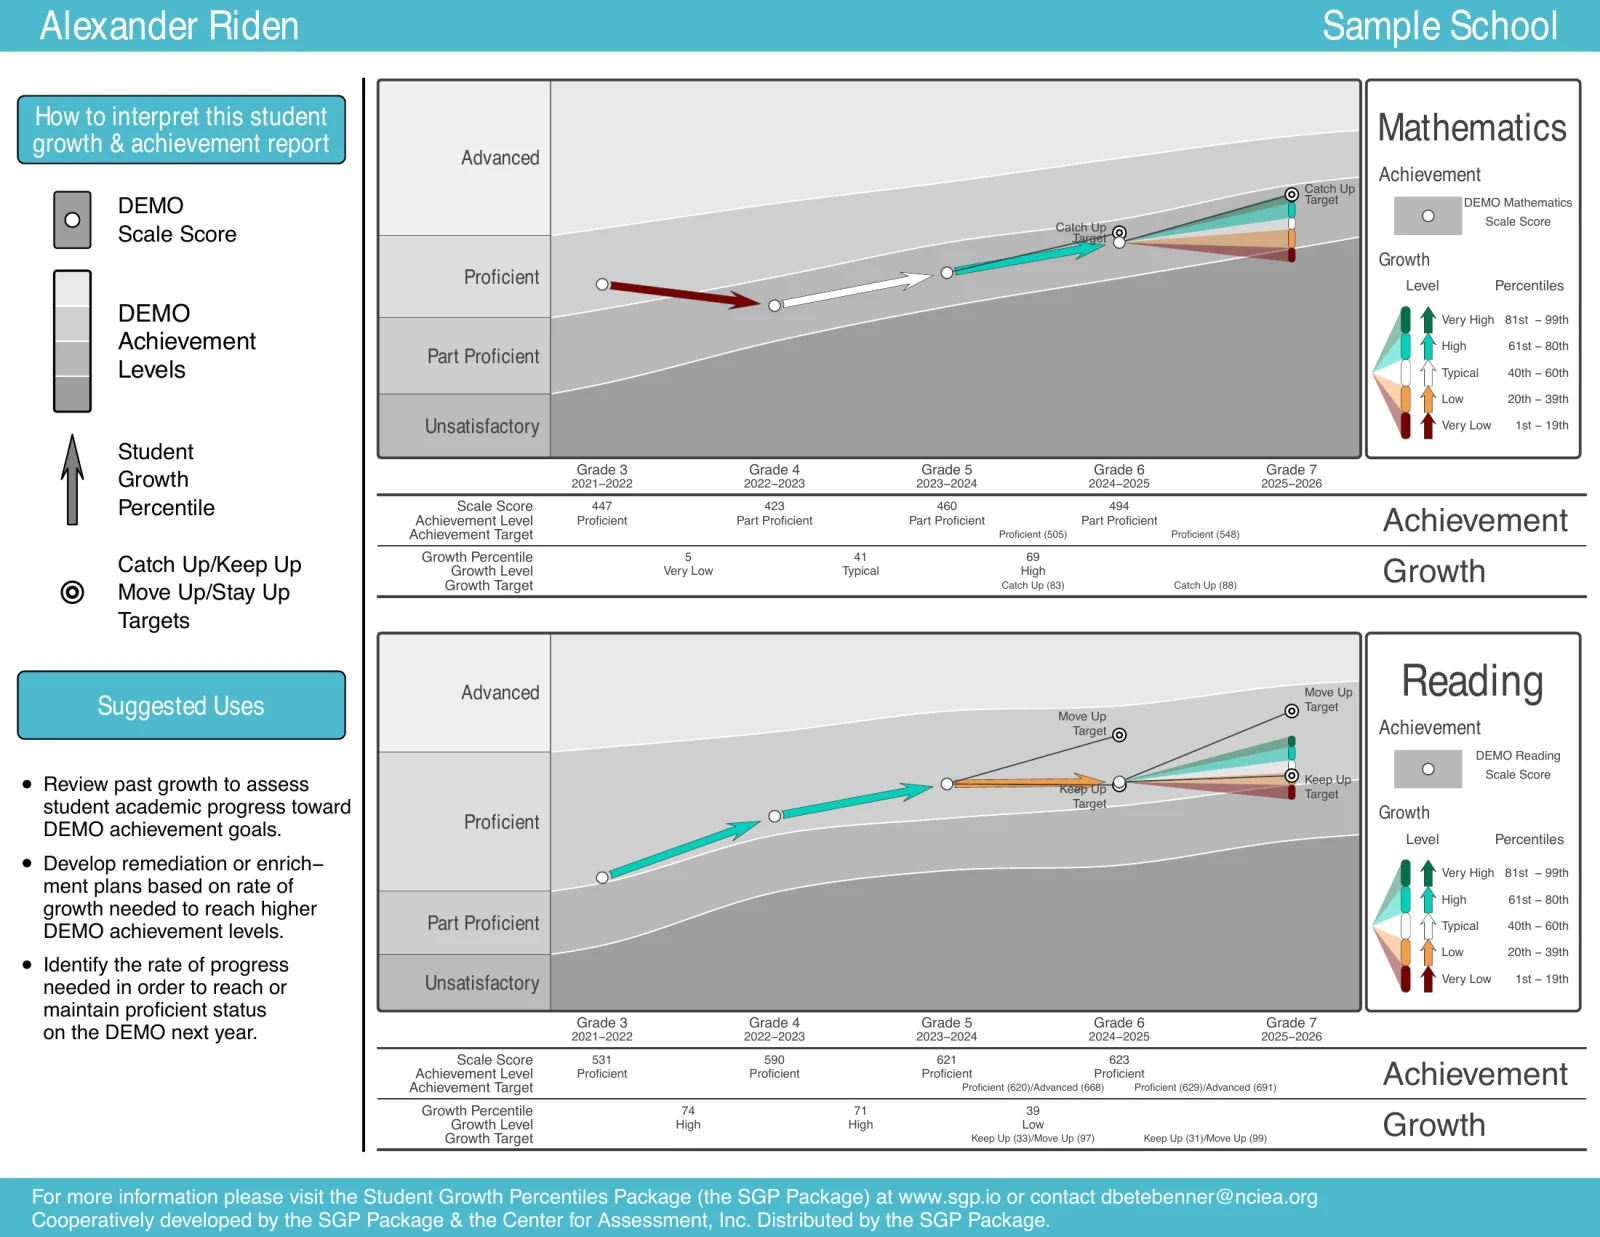
Demonstration: 2024–2025 Mathematics Growth & Achievement
Going from Students to Schools
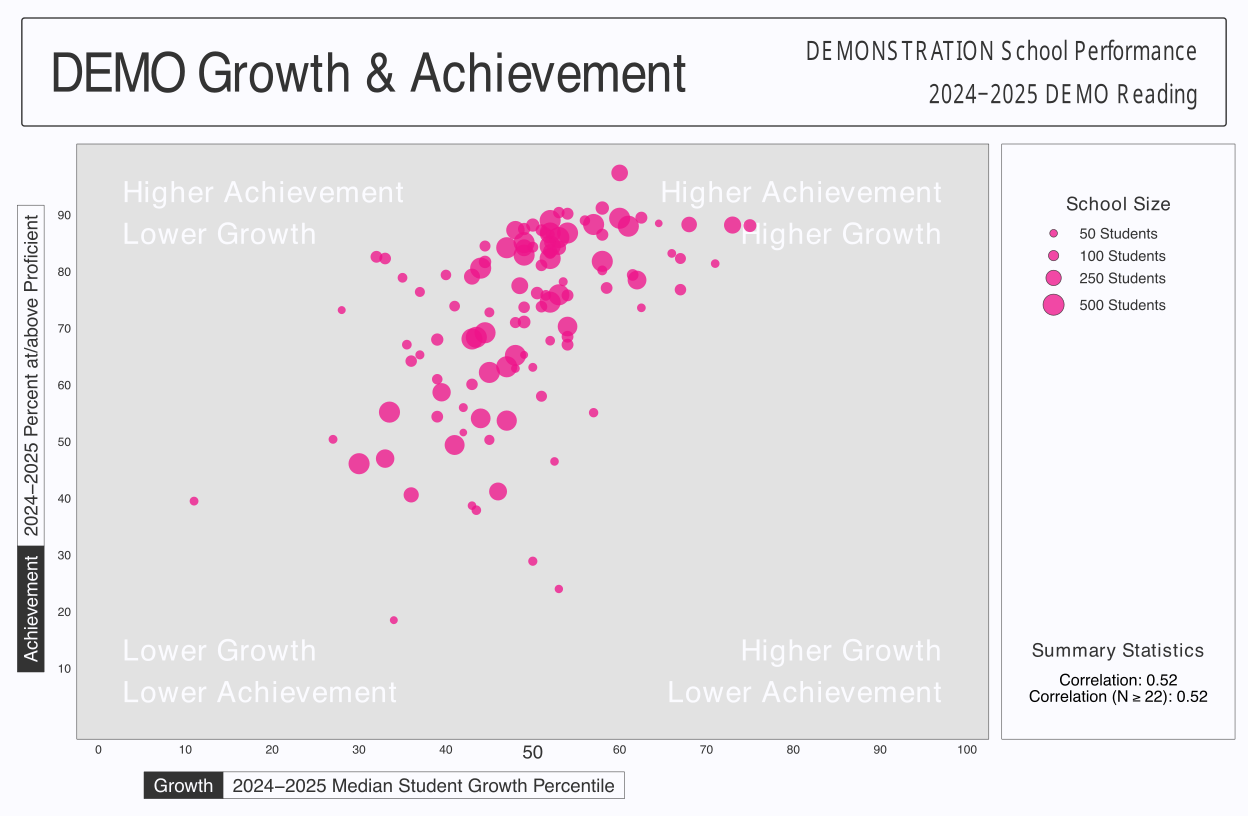
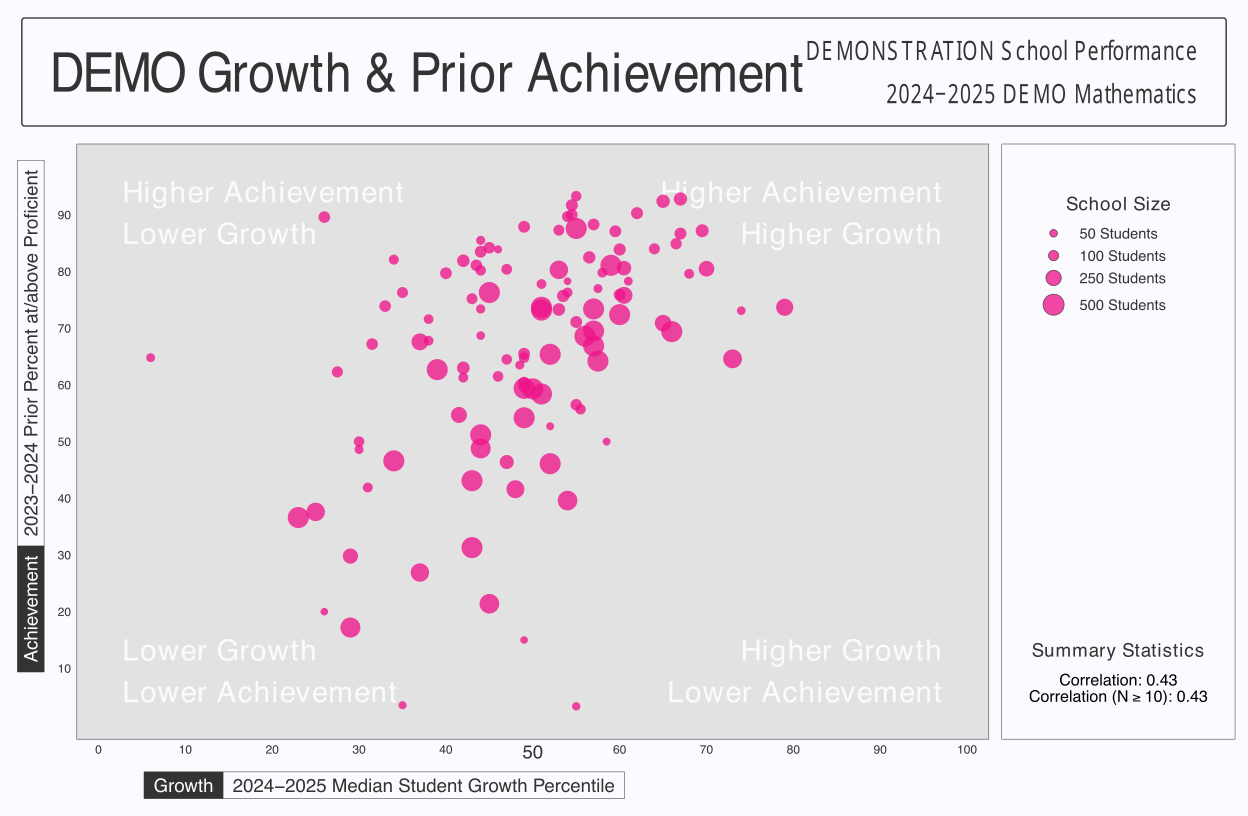
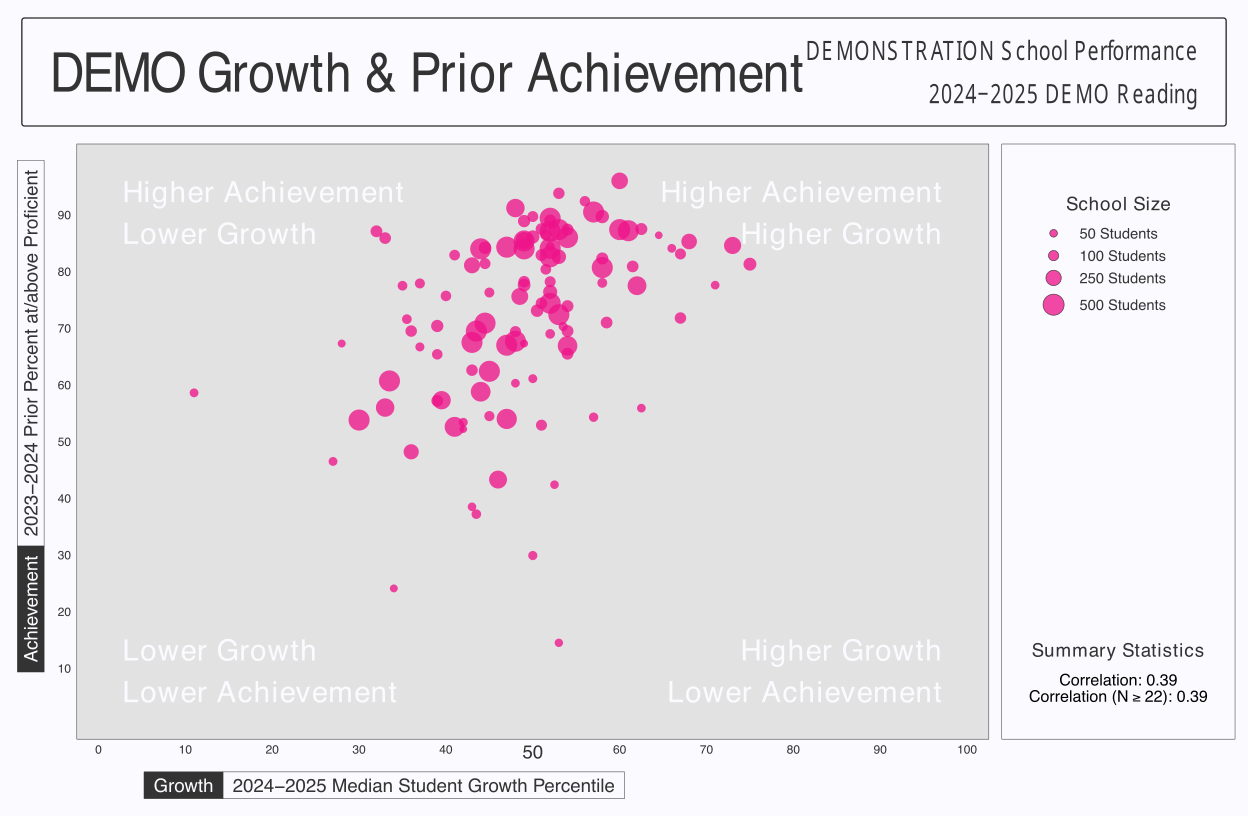
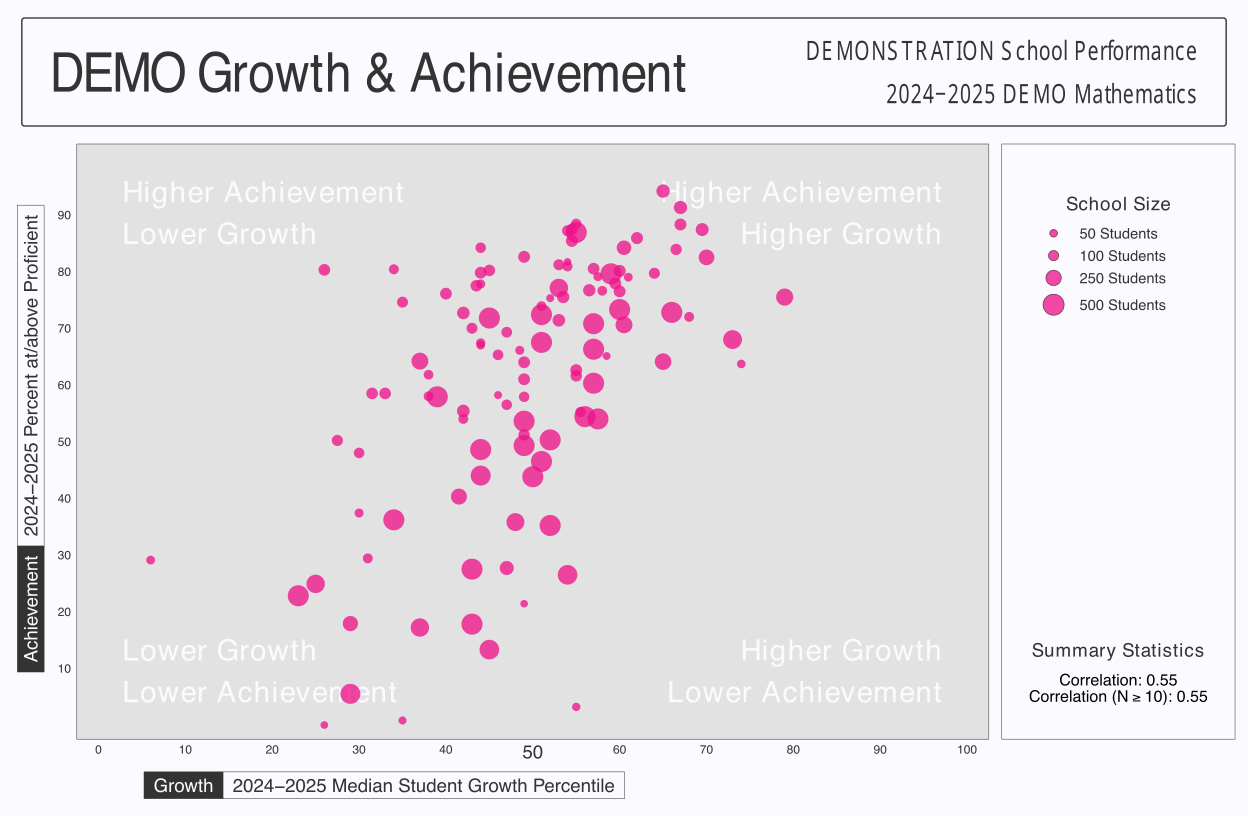
It’s of interest to examine schools where students demonstrate, on average, extraordinarily high and low student growth.
To summarize the student growth percentiles associated with a school (or other grouping) calculate the median of the student growth percentiles.
If students were randomly assigned to schools, expect to see a median of 50.
Values greatly above or below 50 are of interest in identifying best practices or providing extra support.
Examining growth with achievement sheds new light on school performance.
DEMO Growth & Prior Achievement: Mathematics
DEMO Growth & Prior Achievement: Reading
DEMO Growth & Achievement: Mathematics
DEMO Growth & Achievement: Reading